

Bakkt stock gains as Q3 2026 earnings anticipation fuels speculative positioning

Bakkt (BKKT) stock is trading at $4.92, marking a daily increase of 2.71%. The price remains below its short- and medium-term moving averages, reflecting an ongoing challenge to regain momentum.
 4.82
5.33
Highlights
- Bakkt will report third quarter 2026 financial results after market close on November 9, 2026.
- Anticipation of the earnings release has driven increased trading volume and speculative demand for Bakkt stock.
- Bakkt stock trades below key moving averages, with technical indicators skewed bearish and an expected range of $4.44 to $5.4.
Speculative demand rises as pre-earnings positioning intensifies before Q3 report
Bakkt has announced that it will release its third quarter 2026 financial results after the market closes on November 9, 2026, according to GlobeNewswire. The scheduled earnings disclosure has heightened information flow and prompted pre-earnings positioning, as investors adjust exposure ahead of anticipated volatility. This event has contributed to increased trading activity and speculative demand for BKKT in the lead-up to the results.
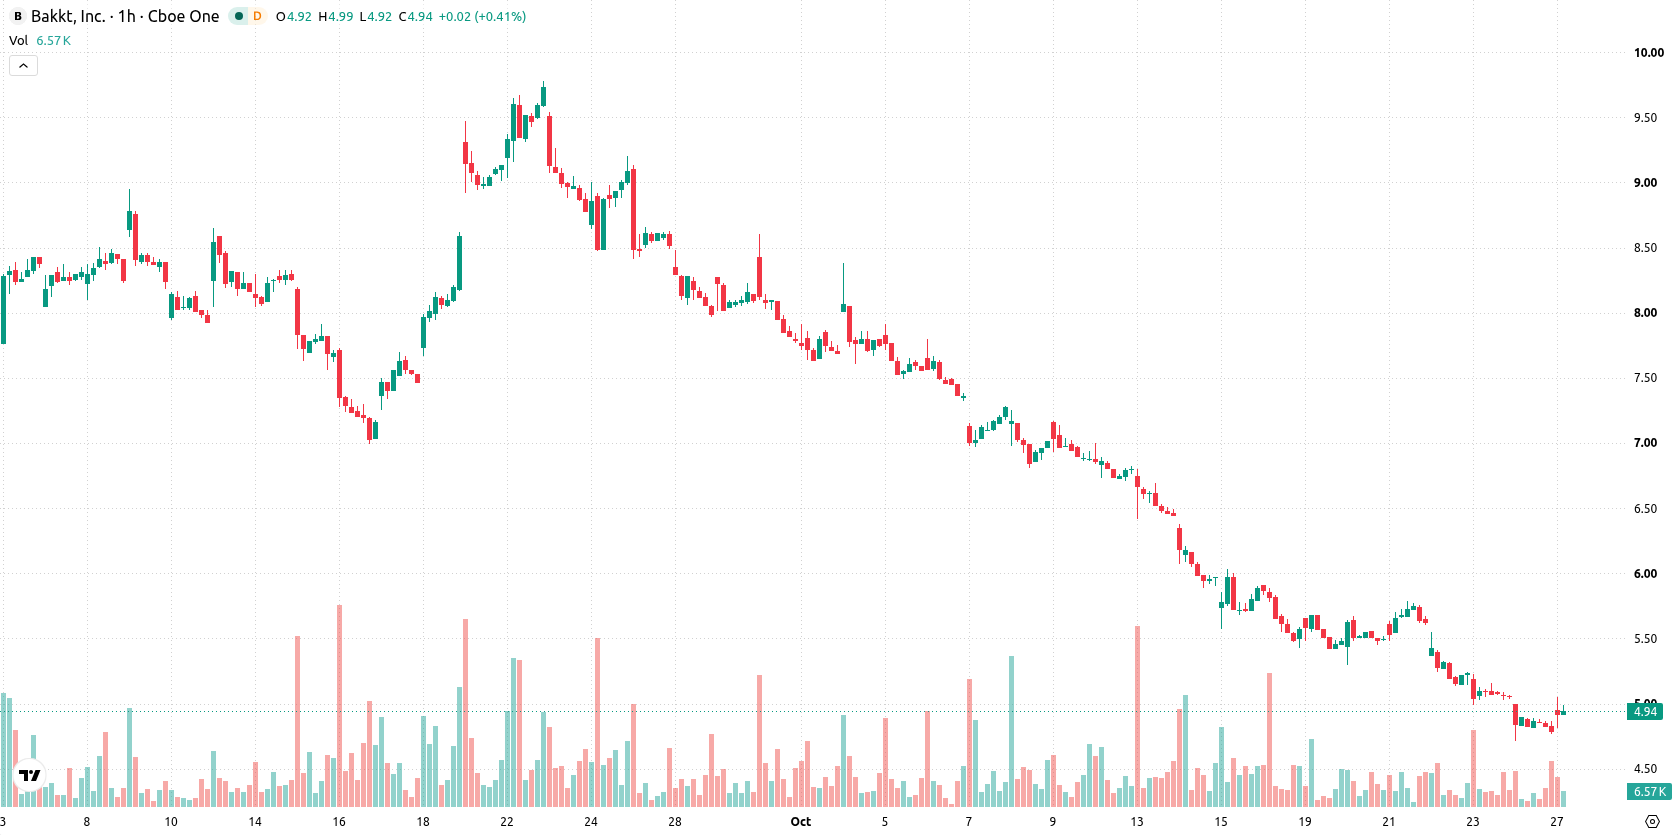
Conflicting sell signals and resistance define technical outlook
On the technical side, BKKT is trading below its MA-20 and MA-50 on the hourly chart and remains well under the MA-200 on the daily chart. The Ichimoku Kijun at $5.25 marks immediate resistance. Momentum indicators provide a mixed picture: RSI is notably low at 25.69, signaling a Sell, while MACD and ADX also indicate a Sell bias. The CCI shows the asset as Oversold, and Stochastic RSI is Neutral, outlining some discrepancy among oscillators. Bull/Bear Power points to sellers dominating momentum, whereas the Awesome Oscillator is neutral, highlighting conflicting short-term signals despite today's upward move.
Downside risk prevails as $5.25 becomes pivotal breakout level
In the short term, BKKT is expected to trade within the $4.44 to $5.4 range, representing the typical volatility band relative to current levels. There is a 70% probability of a downward move and a 30% chance of an upswing, suggesting that further upside is less likely unless buyers reclaim $5.25. If price breaks above this resistance, a momentum-driven rally could follow; however, a move below $4.44 may accelerate selling pressure and extend losses beyond current support.
Earlier, analysts noted that Bakkt remained under technical pressure with downside risks continuing to dominate its outlook. The current mixed technical signals and heightened trading ahead of earnings suggest traders should closely monitor price action around the $5.25 resistance, as a breakout or failure at this level could determine Bakkt's next directional move.






Latest Bakkt News




-
 Afghanistan
-
 Albania
-
 Algeria
-
 Angola
-
 Argentina
-
 Armenia
-
 Australia
-
 Austria
-
 Azerbaijan
-
 Bahamas
-
 Bahrain
-
 Bangladesh
-
 Belarus
-
 Belgium
-
 Bolivia
-
 Botswana
-
 Brazil
-
 Brunei
-
 Bulgaria
-
 Cambodia
-
 Cameroon
-
 Canada
-
 Chile
-
 China
-
 Colombia
-
 Congo
-
 Costa Rica
-
 Cote d'Ivoire
-
 Croatia
-
 Cuba
-
 Cyprus
-
 Czechia
-
 DR Congo
-
 Denmark
-
 Dominican Republic
-
 Ecuador
-
 Egypt
-
 El Salvador
-
 Estonia
-
 Eswatini
-
 Ethiopia
-
 Finland
-
 France
-
 Georgia
-
 Germany
-
 Ghana
-
 Greece
-
 Haiti
-
 Hong Kong
-
 Hungary
-
 India
-
 Indonesia
-
 Iran, Islamic republic
-
 Iraq
-
 Ireland
-
 Israel
-
 Italy
-
 Jamaica
-
 Japan
-
 Jordan
-
 Kazakhstan
-
 Kenya
-
 Korea
-
 Kuwait
-
 Kyrgyzstan
-
 Laos
-
 Latvia
-
 Lebanon
-
 Lesotho
-
 Libya
-
 Lithuania
-
 Luxembourg
-
 Madagascar
-
 Malaysia
-
 Malta
-
 Mauritius
-
 Mexico
-
 Moldova
-
 Mongolia
-
 Montenegro
-
 Morocco
-
 Mozambique
-
 Myanmar
-
 Namibia
-
 Nepal
-
 Netherlands
-
 New Zealand
-
 Nigeria
-
 North Macedonia
-
 Norway
-
 Oman
-
 Pakistan
-
 Palestine
-
 Panama
-
 Papua New Guinea
-
 Paraguay
-
 Peru
-
 Philippines
-
 Poland
-
 Portugal
-
 Puerto Rico
-
 Qatar
-
 Reunion
-
 Romania
-
 Rwanda
-
 Saudi Arabia
-
 Serbia
-
 Singapore
-
 Slovakia
-
 Slovenia
-
 Somalia
-
 South Africa
-
 Spain
-
 Sri Lanka
-
 Sweden
-
 Switzerland
-
 Syria
-
 Taiwan
-
 Tajikistan
-
 Tanzania
-
 Thailand
-
 Trinidad and Tobago
-
 Tunisia
-
 Turkey
-
 UAE
-
 Uganda
-
 Ukraine
-
 United Kingdom
-
United States
-
 Uruguay
-
 Uzbekistan
-
 Venezuela
-
 Vietnam
-
 Yemen
-
 Zambia
-
 Zimbabwe
- Forex
- Crypto












