


Nano Dimension Ltd (NNDM) climbed 3.35% in an intraday move driven by short-covering and lingering oversold conditions. The rebound looks limited, with the price still trading below the 20-day, 50-day, and 200-day moving averages.
 1.39
1.45
Highlights
- Shares of Nano Dimension trade below the 20-day, 50-day, and 200-day moving averages, indicating persistent selling pressure.
- Technical indicators show weak momentum and oversold conditions, with sellers controlling intraday moves despite a 3.35% advance to $1.39.
- The expected price range for the next five trading days is $1.32 to $1.44, with downside risk exceeding 80%.
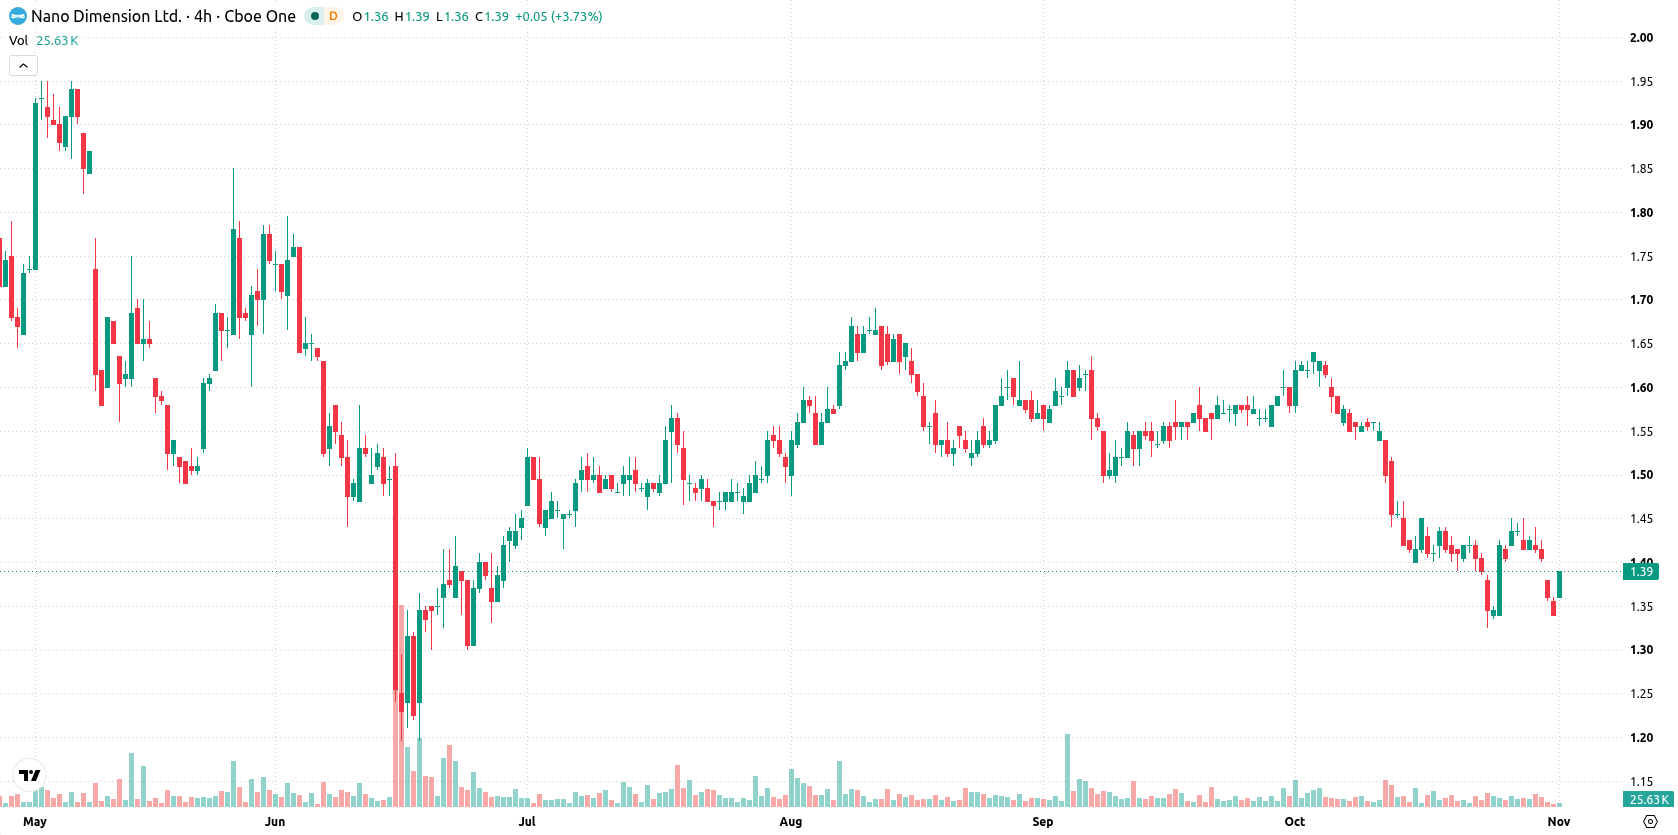
Persistent bearish momentum as sellers maintain pressure below key averages
Nano Dimension is trading below the 20-day, 50-day, and 200-day moving averages at $1.45, $1.52, and $1.64 respectively, confirming ongoing pressure from sellers across short, medium, and long-term trends. The near-term floor is set at $1.35 with immediate resistance at $1.44, while the 50-day versus 200-day alignment remains bearish and the Ichimoku Kijun at $1.48 acts as distant resistance. Momentum signals remain weak, with both the Moving Average Convergence Divergence (MACD) and the Average Directional Index (ADX) indicating a sell bias. The Relative Strength Index (RSI) at 33.86 and Stochastic RSI at 32.87 are both in sell territory, while the Commodity Channel Index (CCI) reads -109.76, marking oversold conditions. Sellers dominate intraday momentum, as shown by Bull/Bear Power (BBP) at -0.03, which further reinforces the oversold environment. Despite the upward move, the intraday tone reflects lingering downside pressure as momentum indicators reinforce the prevailing bearish sentiment.
Earlier, analysts noted that Nano Dimension was showing persistent technical weakness and a bearish trend. The current analysis reaffirms this negative outlook, with ongoing downside pressure highlighting $1.32 as an important support level to monitor in the days ahead.






Latest Nano Dimension News




-
 Afghanistan
-
 Albania
-
 Algeria
-
 Angola
-
 Argentina
-
 Armenia
-
 Australia
-
 Austria
-
 Azerbaijan
-
 Bahamas
-
 Bahrain
-
 Bangladesh
-
 Belarus
-
 Belgium
-
 Bolivia
-
 Botswana
-
 Brazil
-
 Brunei
-
 Bulgaria
-
 Cambodia
-
 Cameroon
-
 Canada
-
 Chile
-
 China
-
 Colombia
-
 Congo
-
 Costa Rica
-
 Cote d'Ivoire
-
 Croatia
-
 Cuba
-
 Cyprus
-
 Czechia
-
 DR Congo
-
 Denmark
-
 Dominican Republic
-
 Ecuador
-
 Egypt
-
 El Salvador
-
 Estonia
-
 Eswatini
-
 Ethiopia
-
 Finland
-
 France
-
 Georgia
-
 Germany
-
 Ghana
-
 Greece
-
 Haiti
-
 Hong Kong
-
 Hungary
-
 India
-
 Indonesia
-
 Iran, Islamic republic
-
 Iraq
-
 Ireland
-
 Israel
-
 Italy
-
 Jamaica
-
 Japan
-
 Jordan
-
 Kazakhstan
-
 Kenya
-
 Korea
-
 Kuwait
-
 Kyrgyzstan
-
 Laos
-
 Latvia
-
 Lebanon
-
 Lesotho
-
 Libya
-
 Lithuania
-
 Luxembourg
-
 Madagascar
-
 Malaysia
-
 Malta
-
 Mauritius
-
 Mexico
-
 Moldova
-
 Mongolia
-
 Montenegro
-
 Morocco
-
 Mozambique
-
 Myanmar
-
 Namibia
-
 Nepal
-
 Netherlands
-
 New Zealand
-
 Nigeria
-
 North Macedonia
-
 Norway
-
 Oman
-
 Pakistan
-
 Palestine
-
 Panama
-
 Papua New Guinea
-
 Paraguay
-
 Peru
-
 Philippines
-
 Poland
-
 Portugal
-
 Puerto Rico
-
 Qatar
-
 Reunion
-
 Romania
-
 Rwanda
-
 Saudi Arabia
-
 Serbia
-
 Singapore
-
 Slovakia
-
 Slovenia
-
 Somalia
-
 South Africa
-
 Spain
-
 Sri Lanka
-
 Sweden
-
 Switzerland
-
 Syria
-
 Taiwan
-
 Tajikistan
-
 Tanzania
-
 Thailand
-
 Trinidad and Tobago
-
 Tunisia
-
 Turkey
-
 UAE
-
 Uganda
-
 Ukraine
-
 United Kingdom
-
United States
-
 Uruguay
-
 Uzbekistan
-
 Venezuela
-
 Vietnam
-
 Yemen
-
 Zambia
-
 Zimbabwe
- Forex
- Crypto












