

Nano Dimension stock remains flat as weak momentum persists below resistance

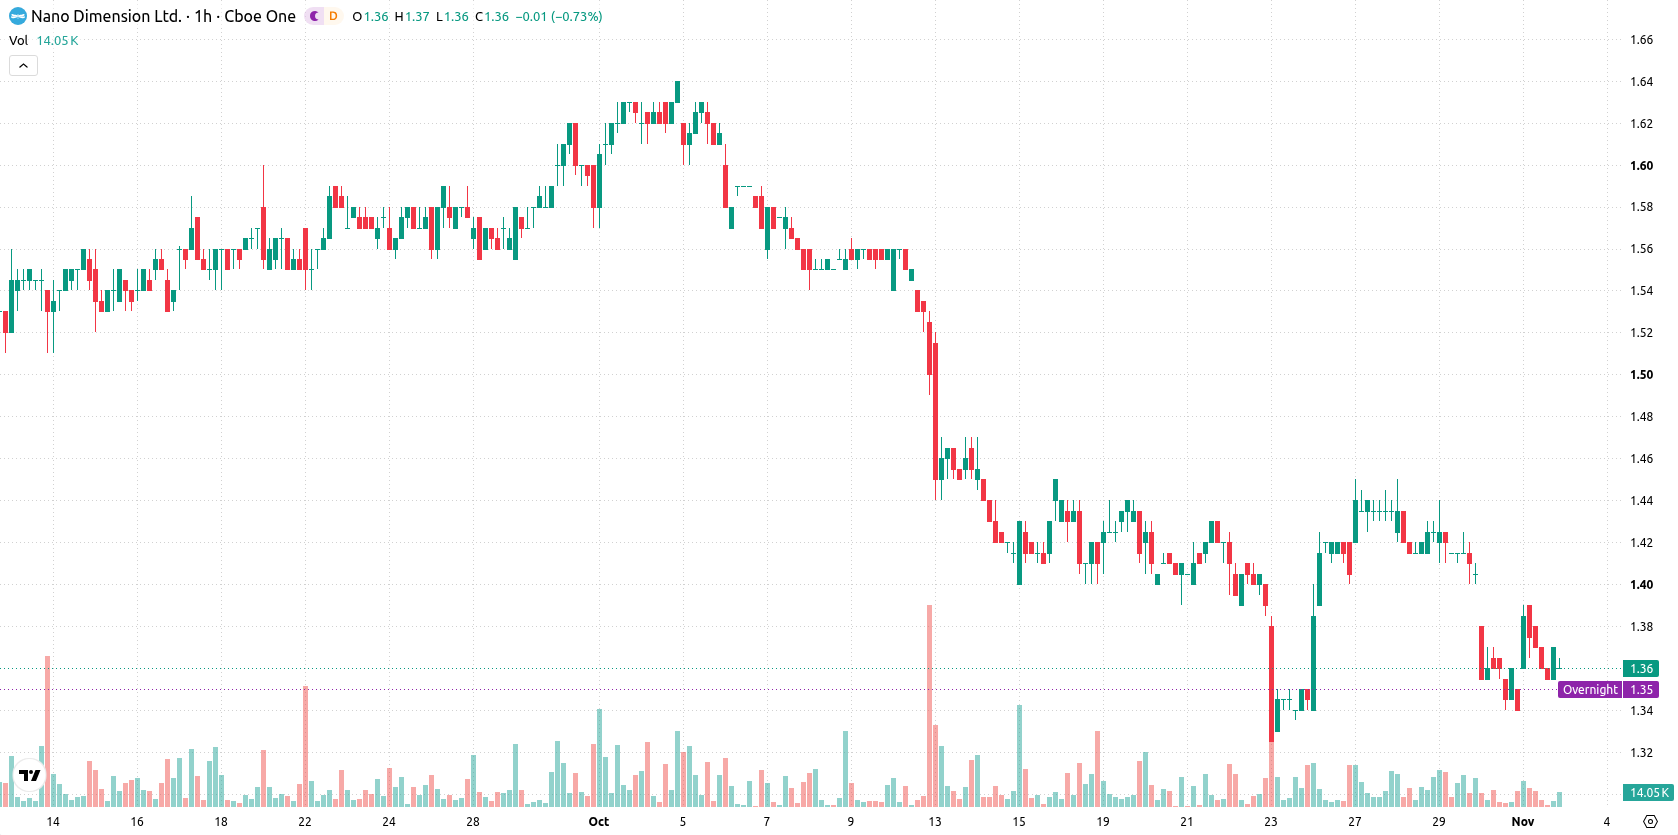
Nano Dimension (NNDM) stock is trading at $1.35, recording a modest uptick over the previous session. The price sits below its key moving averages, indicating limited upward momentum relative to recent trends.
 1.39
1.45
Highlights
- NNDM/USD trades below key short- and long-term moving averages, reflecting sustained downward momentum in the stock.
- Multiple technical indicators, including MACD, ADX, and oscillators, confirm a strong bearish trend with low probability of short-term upside reversal.
- Key price range for the next several days stands at $1.3 to $1.4, with immediate resistance at $1.39 and risk of new lows if $1.3 breaks.
Technical sell signals mount as resistance and bearish momentum persist
On the technical side, NNDM/USD is trading below its MA-20 and MA-50 on the hourly chart, and remains below the MA-200 on the daily timeframe. The Ichimoku Kijun immediate resistance stands at $1.39. Momentum indicators remain weak: both MACD and ADX are signaling a sell on the hourly, RSI is at 40.81, with CCI also in Sell, and Stochastic RSI pointing to Strong Sell. Bull/Bear Power shows some buyer pressure intraday, which diverges from the dominant bearish signals in other indicators, while the Awesome Oscillator aligns to the downside.
Downside favored as breakout odds remain limited
Looking ahead, the expected price range for NNDM over the next several days is $1.3 to $1.4, reflecting typical volatility relative to current levels. The probability of an upward breakout remains very low, while the chance of continued downside is high. Price action is likely to stay capped within the established corridor unless NNDM moves above the immediate $1.39 Kijun resistance. A bearish breakdown would be confirmed if price slips below $1.3, opening the door to new short-term lows.
Earlier, analysts noted that Nano Dimension was exhibiting persistent technical weakness and a prevailing bearish trend. This current analysis strengthens that conclusion, as fresh momentum indicators reinforce downside risk and highlight $1.39 as the critical level that traders should monitor for any sign of a reversal.






Latest Nano Dimension News




-
 Afghanistan
-
 Albania
-
 Algeria
-
 Angola
-
 Argentina
-
 Armenia
-
 Australia
-
 Austria
-
 Azerbaijan
-
 Bahamas
-
 Bahrain
-
 Bangladesh
-
 Belarus
-
 Belgium
-
 Bolivia
-
 Botswana
-
 Brazil
-
 Brunei
-
 Bulgaria
-
 Cambodia
-
 Cameroon
-
 Canada
-
 Chile
-
 China
-
 Colombia
-
 Congo
-
 Costa Rica
-
 Cote d'Ivoire
-
 Croatia
-
 Cuba
-
 Cyprus
-
 Czechia
-
 DR Congo
-
 Denmark
-
 Dominican Republic
-
 Ecuador
-
 Egypt
-
 El Salvador
-
 Estonia
-
 Eswatini
-
 Ethiopia
-
 Finland
-
 France
-
 Georgia
-
 Germany
-
 Ghana
-
 Greece
-
 Haiti
-
 Hong Kong
-
 Hungary
-
 India
-
 Indonesia
-
 Iran, Islamic republic
-
 Iraq
-
 Ireland
-
 Israel
-
 Italy
-
 Jamaica
-
 Japan
-
 Jordan
-
 Kazakhstan
-
 Kenya
-
 Korea
-
 Kuwait
-
 Kyrgyzstan
-
 Laos
-
 Latvia
-
 Lebanon
-
 Lesotho
-
 Libya
-
 Lithuania
-
 Luxembourg
-
 Madagascar
-
 Malaysia
-
 Malta
-
 Mauritius
-
 Mexico
-
 Moldova
-
 Mongolia
-
 Montenegro
-
 Morocco
-
 Mozambique
-
 Myanmar
-
 Namibia
-
 Nepal
-
 Netherlands
-
 New Zealand
-
 Nigeria
-
 North Macedonia
-
 Norway
-
 Oman
-
 Pakistan
-
 Palestine
-
 Panama
-
 Papua New Guinea
-
 Paraguay
-
 Peru
-
 Philippines
-
 Poland
-
 Portugal
-
 Puerto Rico
-
 Qatar
-
 Reunion
-
 Romania
-
 Rwanda
-
 Saudi Arabia
-
 Serbia
-
 Singapore
-
 Slovakia
-
 Slovenia
-
 Somalia
-
 South Africa
-
 Spain
-
 Sri Lanka
-
 Sweden
-
 Switzerland
-
 Syria
-
 Taiwan
-
 Tajikistan
-
 Tanzania
-
 Thailand
-
 Trinidad and Tobago
-
 Tunisia
-
 Turkey
-
 UAE
-
 Uganda
-
 Ukraine
-
 United Kingdom
-
United States
-
 Uruguay
-
 Uzbekistan
-
 Venezuela
-
 Vietnam
-
 Yemen
-
 Zambia
-
 Zimbabwe
- Forex
- Crypto












