

BT Group increases dividend and acquires TalkTalk: Can BT-A regain positive momentum?

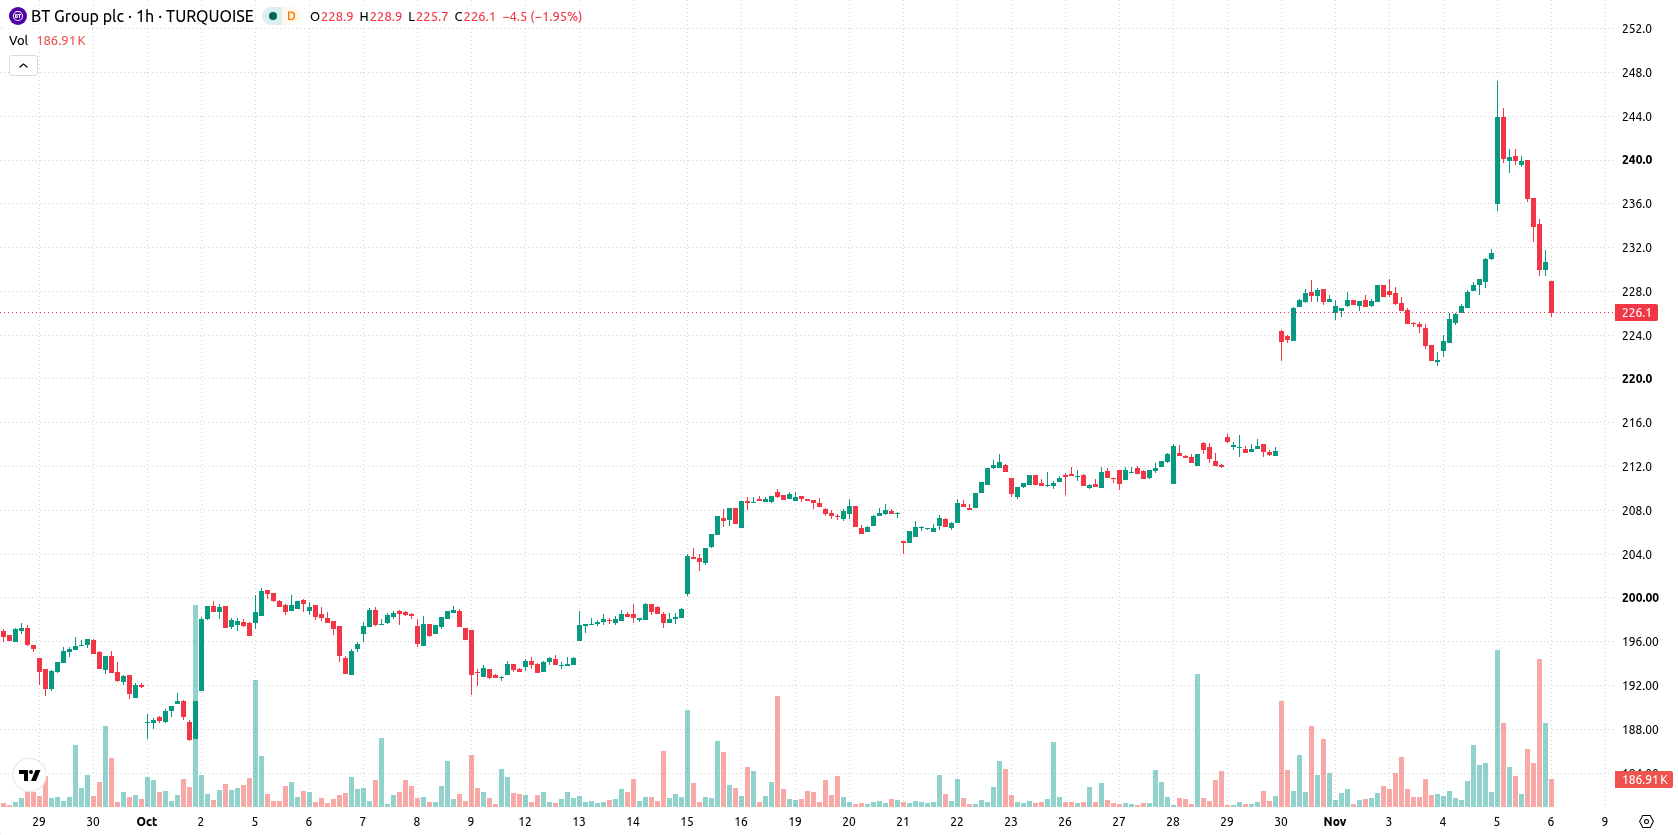
BT Group (BT-A) stock is trading at GBX230.5, showing a modest daily decline and ending near the session low amid high volatility. The price remains below its near-term average yet sits above medium- and long-term benchmarks, highlighting mixed momentum across different timeframes.
 247.30
Highlights
- BT Group reported 1% year-on-year growth in both revenue and adjusted EBITDA for the first half of fiscal 2027.
- Normalized free cash flow fell 59% to £236 million, with the acquisition of TalkTalk adding an expected £400 million cost for the year.
- Shares of BT-A/GBX exhibit short-term downward pressure but medium-term support, with a projected GBX218.78 to GBX242.22 range and a 67% probability of an upward move.
Cash flow pressure and TalkTalk acquisition offset revenue, dividend gains
BT Group posted a 1% increase in both revenue and adjusted EBITDA for the first half of fiscal 2027, accompanied by a 2% rise in its interim dividend to 2.50 pence per share, according to Newsroom Bt. This steady operational performance was tempered by a 59% year-on-year decline in normalized free cash flow to £236 million due to higher working capital outflows, as reported by Yahoo Finance. The group also completed the acquisition of TalkTalk out of administration on October 5, 2026, ensuring service continuity for approximately 2.5 million UK customers at an expected cost of £400 million for the fiscal year, according to Yahoo Finance.
Mixed indicator signals as short-term weakness contrasts mid-term support
On the technical side, BT-A/GBX is currently below its MA-20 on the H1 chart but remains above the MA-50 on the same timeframe and MA-200 on the daily. Immediate resistance is marked by the Ichimoku Kijun at GBX234.2. Momentum indicators are mixed: MACD signals a strong buy, ADX gives a buy, while RSI and CCI are neutral. Stochastic RSI is in oversold territory, highlighting scope for a short-term recovery, whereas Bull/Bear Power reflects intraday seller dominance and the Awesome Oscillator remains neutral.
Breakout hinges on resistance clearance amid contained trading range
In the coming days, BT-A is expected to trade within a volatility band of GBX218.78 to GBX242.22. With a 67% probability assigned to an upward move, any bullish scenario would require a decisive break above the immediate resistance near GBX234.2. Conversely, a break below the lower end of the projected range would signal the emergence of a bearish scenario. The baseline expectation is for price action to remain contained within the defined band absent a fresh catalyst.
Earlier, analysts noted that BT’s improving profitability and commitment to cost-cutting and fibre expansion were fostering cautious optimism about its longer-term financial prospects. The current performance underscores the ongoing impact of these strategies, but with normalized free cash flow under pressure, the key level to watch in the near term is a sustained move above GBX234.2 to confirm a bullish momentum shift.






Latest BT Group News





-
 Afghanistan
-
 Albania
-
 Algeria
-
 Angola
-
 Argentina
-
 Armenia
-
 Australia
-
 Austria
-
 Azerbaijan
-
 Bahamas
-
 Bahrain
-
 Bangladesh
-
 Belarus
-
 Belgium
-
 Bolivia
-
 Botswana
-
 Brazil
-
 Brunei
-
 Bulgaria
-
 Cambodia
-
 Cameroon
-
 Canada
-
 Chile
-
 China
-
 Colombia
-
 Congo
-
 Costa Rica
-
 Cote d'Ivoire
-
 Croatia
-
 Cuba
-
 Cyprus
-
 Czechia
-
 DR Congo
-
 Denmark
-
 Dominican Republic
-
 Ecuador
-
 Egypt
-
 El Salvador
-
 Estonia
-
 Eswatini
-
 Ethiopia
-
 Finland
-
 France
-
 Georgia
-
 Germany
-
 Ghana
-
 Greece
-
 Haiti
-
 Hong Kong
-
 Hungary
-
 India
-
 Indonesia
-
 Iran, Islamic republic
-
 Iraq
-
 Ireland
-
 Israel
-
 Italy
-
 Jamaica
-
 Japan
-
 Jordan
-
 Kazakhstan
-
 Kenya
-
 Korea
-
 Kuwait
-
 Kyrgyzstan
-
 Laos
-
 Latvia
-
 Lebanon
-
 Lesotho
-
 Libya
-
 Lithuania
-
 Luxembourg
-
 Madagascar
-
 Malaysia
-
 Malta
-
 Mauritius
-
 Mexico
-
 Moldova
-
 Mongolia
-
 Montenegro
-
 Morocco
-
 Mozambique
-
 Myanmar
-
 Namibia
-
 Nepal
-
 Netherlands
-
 New Zealand
-
 Nigeria
-
 North Macedonia
-
 Norway
-
 Oman
-
 Pakistan
-
 Palestine
-
 Panama
-
 Papua New Guinea
-
 Paraguay
-
 Peru
-
 Philippines
-
 Poland
-
 Portugal
-
 Puerto Rico
-
 Qatar
-
 Reunion
-
 Romania
-
 Rwanda
-
 Saudi Arabia
-
 Serbia
-
 Singapore
-
 Slovakia
-
 Slovenia
-
 Somalia
-
 South Africa
-
 Spain
-
 Sri Lanka
-
 Sweden
-
 Switzerland
-
 Syria
-
 Taiwan
-
 Tajikistan
-
 Tanzania
-
 Thailand
-
 Trinidad and Tobago
-
 Tunisia
-
 Turkey
-
 UAE
-
 Uganda
-
 Ukraine
-
 United Kingdom
-
United States
-
 Uruguay
-
 Uzbekistan
-
 Venezuela
-
 Vietnam
-
 Yemen
-
 Zambia
-
 Zimbabwe
- Forex
- Crypto












