How Do You Read A Stock Chart For Beginners?

Stock charts show how a stock’s price has moved and changed on a specified timeframe, usually showing the price’s highs and lows within that interval and where the price was at the opening and closing of the timeframe. Traders can observe trends on the chart and use technical analysis and indicators to determine the optimal points for entry and exit points in a trade.
Stock charts are a key part of analysis used in trading but can appear complicated and daunting for beginners. However, it’s vital to understand how to read charts, as it assists in assessing market sentiment, spotting potential entry and exit points, and making informed predictions about future price movements, all of which contribute to a better trading strategy.In this article, we look at the basics of stock charts, how to use technical analysis in stock charts and tips for reading stock charts like a pro.
-
Is chart trading profitable?
According to a long history of research, chart patterns work 50% to 89% of the time, depending on which pattern is used and which market. Using technical analysis on data charts done by many successful stock traders.
-
Why do traders use charts?
They use them as visual representations to analyze market trends, identify patterns, and make informed decisions. The visual nature of charts aids in quickly interpreting complex market information and patterns, facilitating effective decision-making.
-
How do you analyze a stock chart?
Start by identifying trends, support and resistance levels, and key chart patterns. Examine volume trends to confirm price movements and assess market sentiment. Use technical indicators for additional insights. Consider broader market conditions and fundamental factors to make well-rounded decisions and manage risk effectively.
-
How do you read a stock chart signal?
Start by interpreting key indicators like trendlines, support/resistance levels, and candlestick patterns. Next, look for confirmation across multiple timeframes. Analyze volume to validate price movements. A clear understanding of technical and fundamental factors helps to make informed decisions based on signals present in the chart.

The basics of stock charts
Stock charts allow traders to see visualized data about any particular asset over time, typically providing current price movements, historical data including highs and lows, and trading volumes. Stock charts can come in many different visual forms, though they usually track the timeframes along the X-axis and price along the Y-axis. Let’s look at some of the more common types of stock charts:
-
Bar Charts: Bar charts are most useful for showing an asset’s price range for each period. Each vertical line represents the chosen period and shows the lowest and highest price that the asset reached within that time. The absolute bottom of the vertical line is the price low, and the top is the price high. The notch on the left side of the vertical line shows the stock’s price at opening (the beginning of the timeframe) and the notch to the right shows the closing price (its price at the end of the timeframe). Some platforms display the lines in green and red based on whether the price went up or down, respectively. Some also display colored bars at the bottom of the chart to display trading volume.
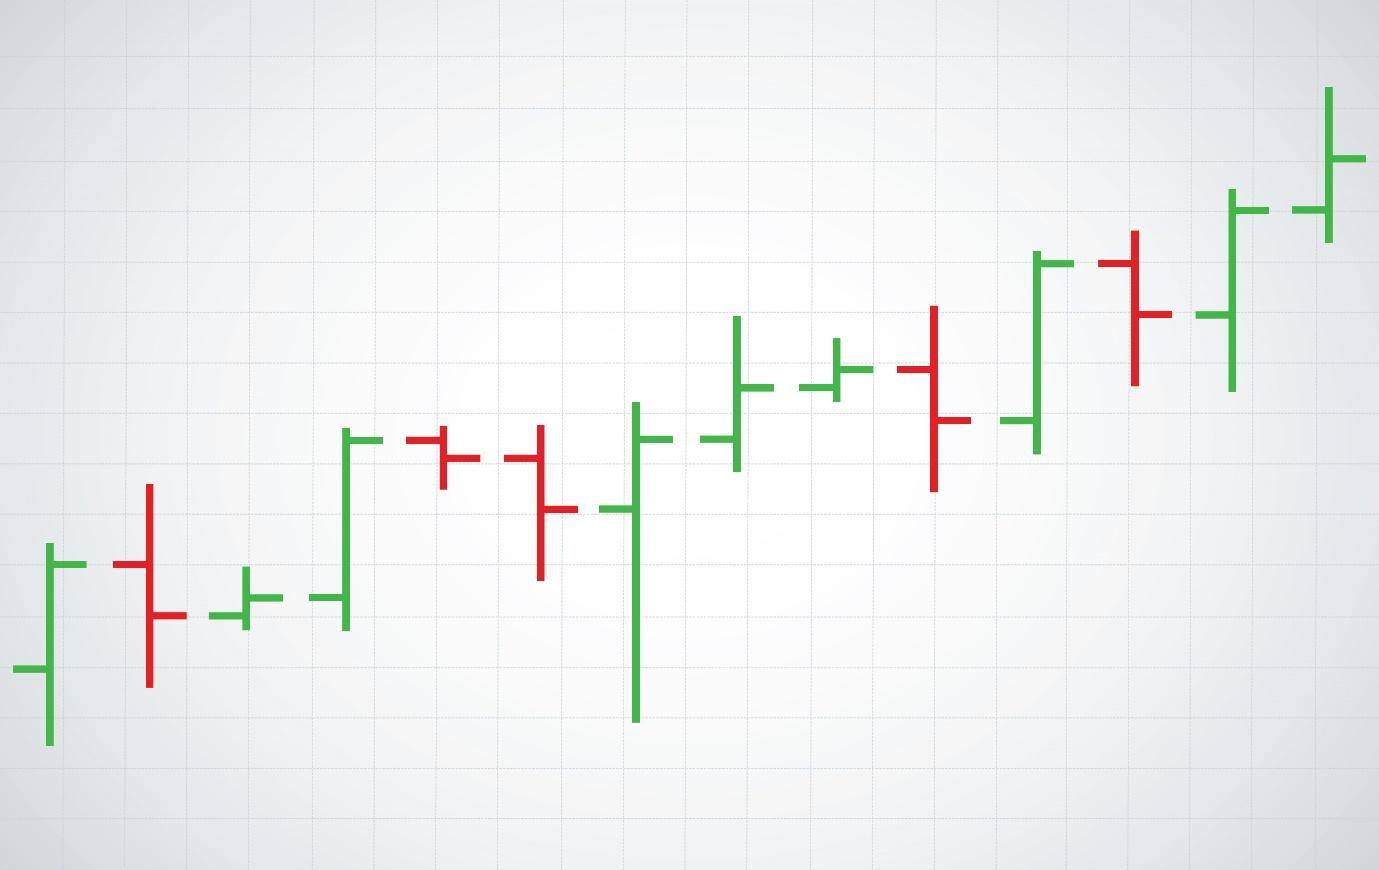
Bar Chart (Source: Vecteezy)
-
Candlestick Charts: A candlestick chart uses bars and lines called candles or candlesticks, to display an asset’s movement within any given timeframe. The main body of a candlestick is colored red or green, representing a decrease or increase in price within the timeframe. The body’s size or length is determined by the price at the open and close of the period. The lines above and below the candle’s body are called the “wick” or “shadow”, and show the highs and lows for the asset in that timeframe.
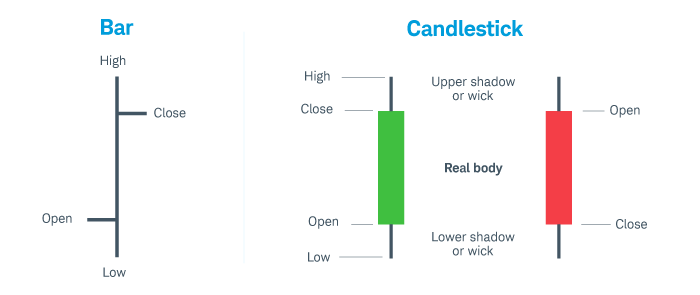
Difference between Bar Chart and Candlestick Chart (Source: schwab.com)
-
Professional Footprint Chart: Sometimes called “cluster” charts or “bid/ask profiles”, these are one of the more professional chart types used by traders. Footprint charts display various pieces of data in number form, such as volume, bid-ask spreads, cumulative volume delta (CVD), and order flow imbalances. Footprint charts use traditional candlestick representing the price high, low, open, and close, then the numbers to the left shows how many sellers sold at the bid price, while numbers on the right side display buyers who lifted the order price. The data allows traders to more precisely analyze the buyer-seller interaction.
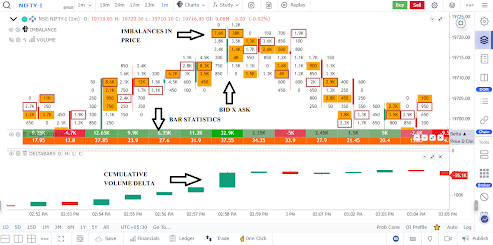
Footprint charts
Key elementsThere are several core components that you will come across in most types of stock charts, which can further your understanding of price movements and contribute to your analysis. Some of these are:
-
OHLC: This stands for Open, High, Low, and Close. Open and Close refer to the opening and closing price of the stock during a specific time. High and Low means the highest and lowest price the stock reached during that interval. Charts that display OHLC, such as bar charts and candlestick charts, provide key information about price movements, which helps traders assess market trends and volatility.
-
Volume Indicator: “Volume” means the total number of shares traded during a given period. A volume indicator shows how much an asset was traded during an interval, and is often displayed as a histogram beneath a price chart, showing spikes during periods of increased trading activity. High volume can indicate strong market interest, while low activity could signify a lack of conviction in a trend.
-
Timeframe: The timeframe, displayed on the X-axis, refers to the duration represented by each candle, bar, or data point on the chart. These timeframes can be set to show movements within individual minutes, 5-minute windows, hours, days, or any interval, depending on your analytical needs. Shorter timeframes provide detailed insights for intraday trading, while longer timeframes offer a broader perspective for long-term investors.
Trends
The Various types of stock charts are primarily helpful for observing trends in a stock’s price movement. Some of the trends you might see are:
-
Uptrend: An uptrend signifies a bullish market and is characterized on a chart by higher highs and higher lows. In an uptrend, each peak (high) is higher than the previous one, and each trough (low) is also higher than the preceding one. Observed on a price chart, an uptrend would visually appear as a series of ascending peaks and troughs.
-
Downtrend: A downtrend is marked by lower highs and lower lows and suggests a bearish market. In a downtrend, each peak is lower than the previous one, and each trough is also lower than the preceding one. Its visual representation on a stock chart would be illustrated by a sequence of descending peaks and troughs.
-
Range-bound or sideways trend: A sideways trend signifies market indecision and occurs when the price fluctuates within a horizontal range, forming a trading range. In this scenario, neither consistent higher highs nor lower lows are established. On a chart, a sideways trend looks like a flat, horizontal price movement without a clear upward or downward slope.
Best stock brokers 2025


Using technical analysis to read stock charts
Technical analysis involves studying historical price charts and trading volumes to predict future price movements. It's a tool used by traders to make informed decisions based on chart patterns and market indicators that they observe on stock charts. When reading a chart, there are key aspects of technical analysis: trendlines, support and resistance levels, and candlestick patterns. Let’s look at those.
-
Trendlines: Trendlines are lines drawn on a stock chart to connect successive lows (uptrend) or highs (downtrend). They visually represent the overall direction of price movement. Trendlines help identify the strength and direction of a trend. Breakouts or breakdowns from trendlines can signal potential trend reversals or continuations, guiding traders in their decision-making process.
-
Support and resistance levels: Support levels are price levels where a stock tends to stop falling, while resistance levels are where it encounters selling pressure. Imagine “support” levels as buyers supporting a stock from falling lower in price by increasing their buying, while “resistance” is where sellers resist a stock’s attempt to climb above a certain level. Traders use support and resistance levels to set entry and exit points, as breakthroughs (pushing past those levels) can indicate significant price movements.
-
Candlestick Patterns: Candlestick patterns provide insights into market psychology. Patterns such as doji, engulfing, and hammers convey market sentiment. Certain patterns indicate potential reversals or continuations, aiding traders in predicting price movements and making strategic decisions.
To learn more about the different types of patterns you can observe in stock charts, see: Best Stock Market Chart Patterns Every Trader Must Know.
Using indicators to read stock charts
An indicator is a mathematical calculation derived from an asset’s price or volume that allows traders to identify signals and trends within the market. Indicators are a key part of technical analysis that, when paired with the right risk management tools, give traders increased insight into ongoing price trends. On a stock chart, indicators are displayed as (usually squiggly) lines below and above the price information and may sometimes be referred to as “overlays”.
Some of the most commonly used indicators, called classical indicators are:
-
Moving Averages: The Moving Average (MA) is a type of indicator that identifies the direction in a price trend is moving. The MA combines the stock’s price points over a specified time frame and divides it by how many data points there are, resulting in an average represented by a single trend line. The MA indicator allows you to examine key support and resistance levels to try and determine future price movements.
-
Oscillators: The stochastic oscillator indicator compares an asset’s closing price to a range of its prices over time to indicate trend strength and momentum, using a scale of 0 to 100. A number below 20 tends to signify an oversold market, indicating that the asset may be undervalued and presenting a potential buying opportunity. Meanwhile, a value above 80 represents an overbought market and signals that the stock is overvalued, signaling a potential selling opportunity.
Some of the more complex professional indicators are:
-
Delta: Delta, represented by the symbol Δ, is a risk metric that attempts to show the change in the price of a derivative such as an options contract. It's not directly plotted on the chart itself but is a crucial metric in options trading.
-
Profile: A market profile is a single graphic chart that displays an asset’s trading history. Represented as a series of numbers and letters combined into a chart representing price movement over time, it demonstrates an asset’s volatility by showing how many units moved and the price-to-volume ratio.
-
Level II: Level II is essentially the order book for the NASDAQ stock exchange. Level II shows a ranked list of the top bid and ask prices from different market participants to give insight into an asset’s price action.
If you would also like to learn about reading Forex charts, you can read: How To Use Technical Indicators To Analyze Forex Charts?
Using fundamentals to read stock charts
The word fundamentals in trading typically refers to a company’s underlying business metrics, such as revenue or earnings per share (EPS). Fundamentals can complement technical analysis when reading stock charts. Understanding a company’s fundamentals works well alongside reading price charts as it provides context for how the price is moving.
For example, consistent dividend payments could contribute to strong support levels on a chart, as income-seeking investors are attracted to stocks with a history of reliable dividend yields. Or, if a positive company earnings report was released during a chart uptrend, this could validate the trend, supporting the idea that the company's financial performance aligns with the stock's positive momentum. If company news such as a product launch coincides with a breakout pattern on a chart, this could signify increased investor interest and potential for sustained price growth.
Tips for reading stock charts like a pro
-
Use Indexes: Assessing market indexes such as the S&P 500 can help you to gauge overall market trends. Indexes provide a broader context for the performance of individual stocks, helping you to identify general market sentiment and potential opportunities.
-
Use Multiple Timeframes: When looking at the historic price data for any given asset, observe it using different timeframes on the chart. Using intervals of minutes, days, and months gives a more comprehensive view. Short-term trends often differ from long-term trends.
-
Backtest Your Trading Strategies: Before implementing strategies in live markets, backtest them using historical data. Simulating trades based on past market conditions to assess the strategy's effectiveness. Choose a past point on a chart and examine what would have happened if you had entered a trade at that time. This helps to refine approaches and understand how strategies may perform in different scenarios.
-
Use Simulators for Training: Utilize trading simulators to practice reading charts and executing trades in a risk-free environment. Simulators mimic real market conditions, allowing you to understand charts and how they display price movements while testing strategies and building confidence without financial risk.
-
Use Scanners: Scanners, also known as stock screeners, are programs or services that comb through huge amounts of market data to find stocks that meet criteria set by the user. Scanners help streamline the process of finding stocks that align with your wider trading strategy.
Summary
Reading stock charts can be a complex and challenging task. There are varying types of charts that display different data in an assortment of ways, so try to experiment with different ones to discover which one aligns with your strategy and visual preference. Use technical and fundamental analysis to support your trading approach and implement our pro tips to maximize your chances of delivering a successful outcome.
Glossary for novice traders
-
1
Robo-Advisor
A Robo-Advisor is a digital platform using automated algorithms to provide investment advice and manage portfolios on behalf of clients, often with lower fees than traditional advisors.
-
2
Day trading
Day trading involves buying and selling financial assets within the same trading day, with the goal of profiting from short-term price fluctuations, and positions are typically not held overnight.
-
3
Volatility
Volatility refers to the degree of variation or fluctuation in the price or value of a financial asset, such as stocks, bonds, or cryptocurrencies, over a period of time. Higher volatility indicates that an asset's price is experiencing more significant and rapid price swings, while lower volatility suggests relatively stable and gradual price movements.
-
4
Stochastic Oscillator
The Stochastic Oscillator is a technical indicator used in financial analysis to gauge the momentum of a security's price and identify overbought or oversold conditions by comparing the closing price to a specified price range over a defined period.
-
5
Risk Management
Risk management is a risk management model that involves controlling potential losses while maximizing profits. The main risk management tools are stop loss, take profit, calculation of position volume taking into account leverage and pip value.
Related Articles


Team that worked on the article

Jason Law is a freelance writer and journalist and a Traders Union website contributor. While his main areas of expertise are currently finance and investing, he’s also a generalist writer covering news, current events, and travel.
Jason’s experience includes being an editor for South24 News and writing for the Vietnam Times newspaper. He is also an avid investor and an active stock and cryptocurrency trader with several years of experience.

Dr. BJ Johnson is a PhD in English Language and an editor with over 15 years of experience. He earned his degree in English Language in the U.S and the UK. In 2020, Dr. Johnson joined the Traders Union team. Since then, he has created over 100 exclusive articles and edited over 300 articles of other authors.

Tobi Opeyemi Amure is an editor and expert writer with over 7 years of experience. In 2023, Tobi joined the Traders Union team as an editor and fact checker, making sure to deliver trustworthy and reliable content. The topics he covers include trading signals, cryptocurrencies, Forex brokers, stock brokers, expert advisors, binary options.
Tobi Opeyemi Amure motto: The journey of a thousand miles begins with a single step.