
Supply/Demand vs. Support/Resistance | Full Guide



Editorial Note: While we adhere to strict Editorial Integrity, this post may contain references to products from our partners. Here's an explanation for How We Make Money. None of the data and information on this webpage constitutes investment advice according to our Disclaimer.
Supply and demand zones represent areas where significant buying or selling pressure causes sharp price reversals, often linked to institutional activity. In contrast, support and resistance levels are price points or ranges where historical trends suggest a tendency for prices to bounce or reverse, often reflecting psychological barriers for traders. While both concepts identify potential turning points, supply/demand zones focus on market imbalances, whereas support/resistance levels emphasize historical price behavior.
This article explores the key differences and similarities between the concepts of supply/demand zones and support/resistance levels in trading. Both are essential tools for identifying price action dynamics, but they stem from distinct principles—supply/demand zones focus on market imbalances caused by institutional orders, while support/resistance levels rely on historical price behavior. Understanding these concepts and how they interrelate can help traders refine their strategies and improve decision-making.
Support/resistance levels and supply/demand zones explained
Support and resistance levels
These are price levels where the price of an asset stops or reverses.
A support level is a price level where demand for an asset is high enough to prevent the price from falling further.
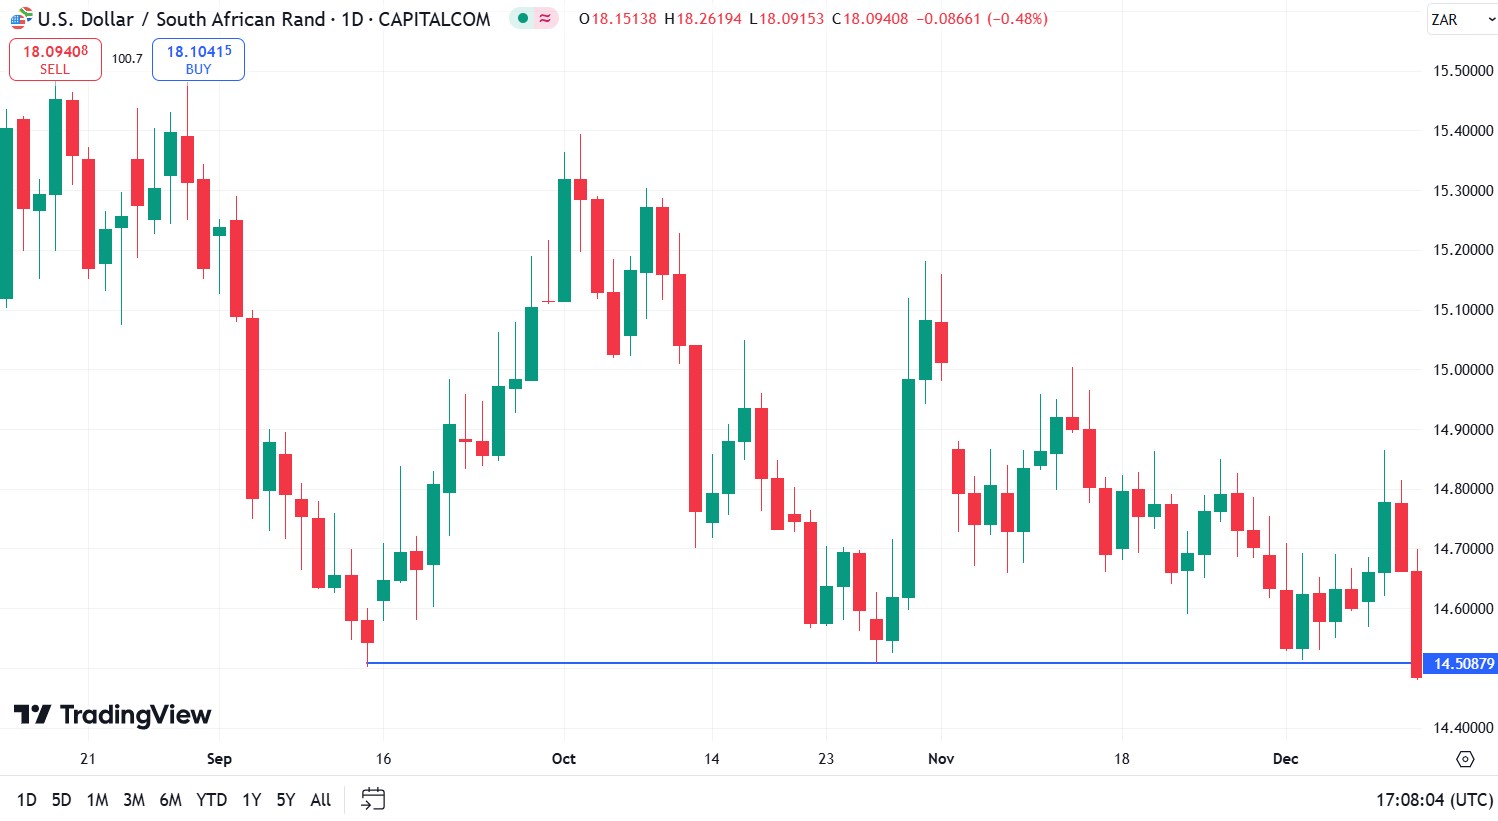
A resistance level is a price level where the supply of an asset exceeds demand, preventing the price from rising further.
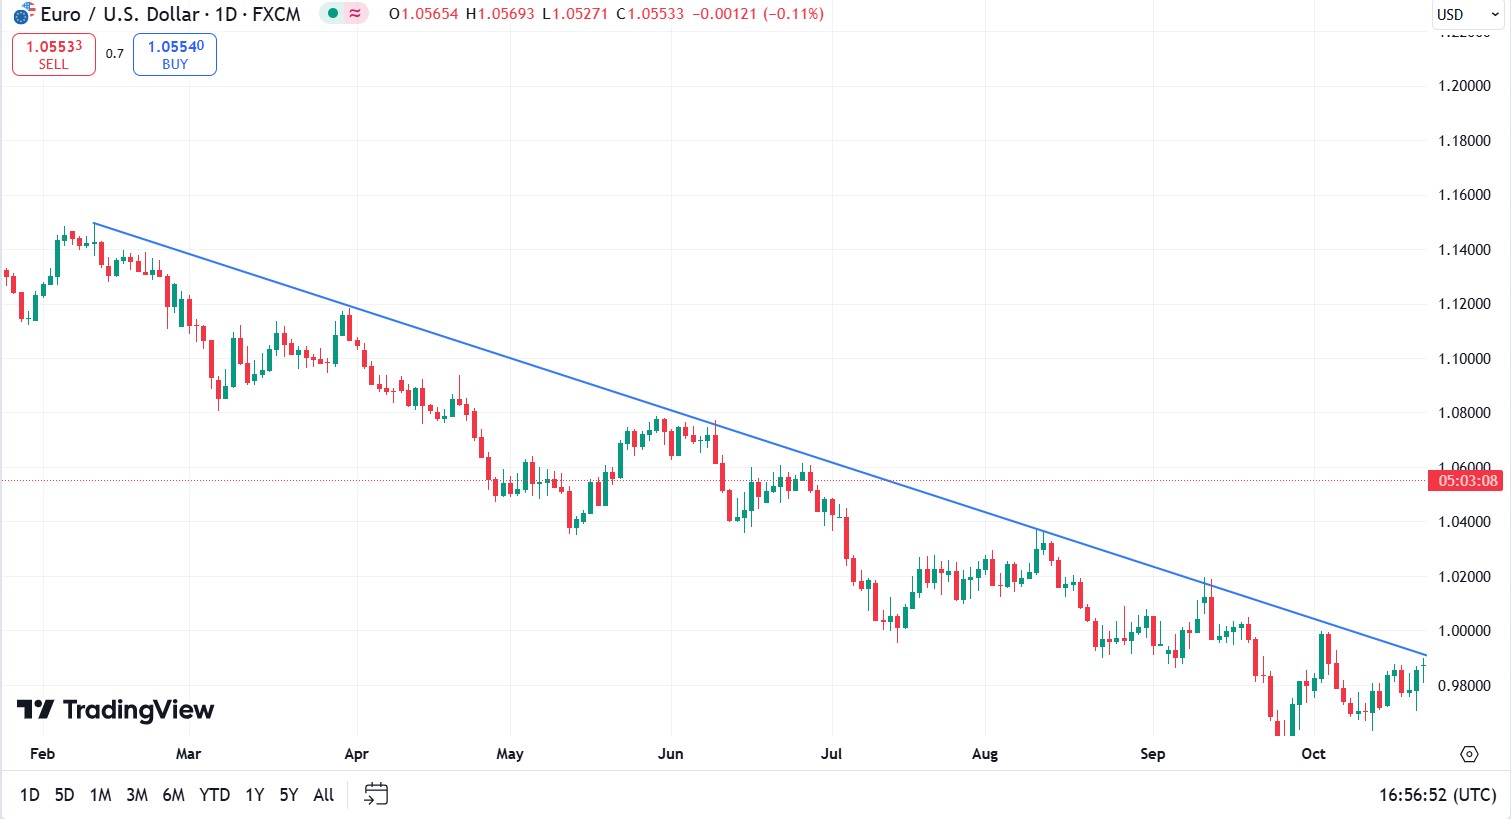
Identifying these levels on charts is done by analyzing previous price highs and lows where the price has previously stopped or reversed. For example, if the price of an asset has repeatedly stopped at $50, this level can be considered a support level. If the price has repeatedly failed to break above $60, this level can be considered a resistance level.
Supply and demand zones
These are areas on a chart where there is a significant imbalance between buyers and sellers, causing sharp price changes.
A demand zone is an area where demand significantly exceeds supply, causing the price to rise.
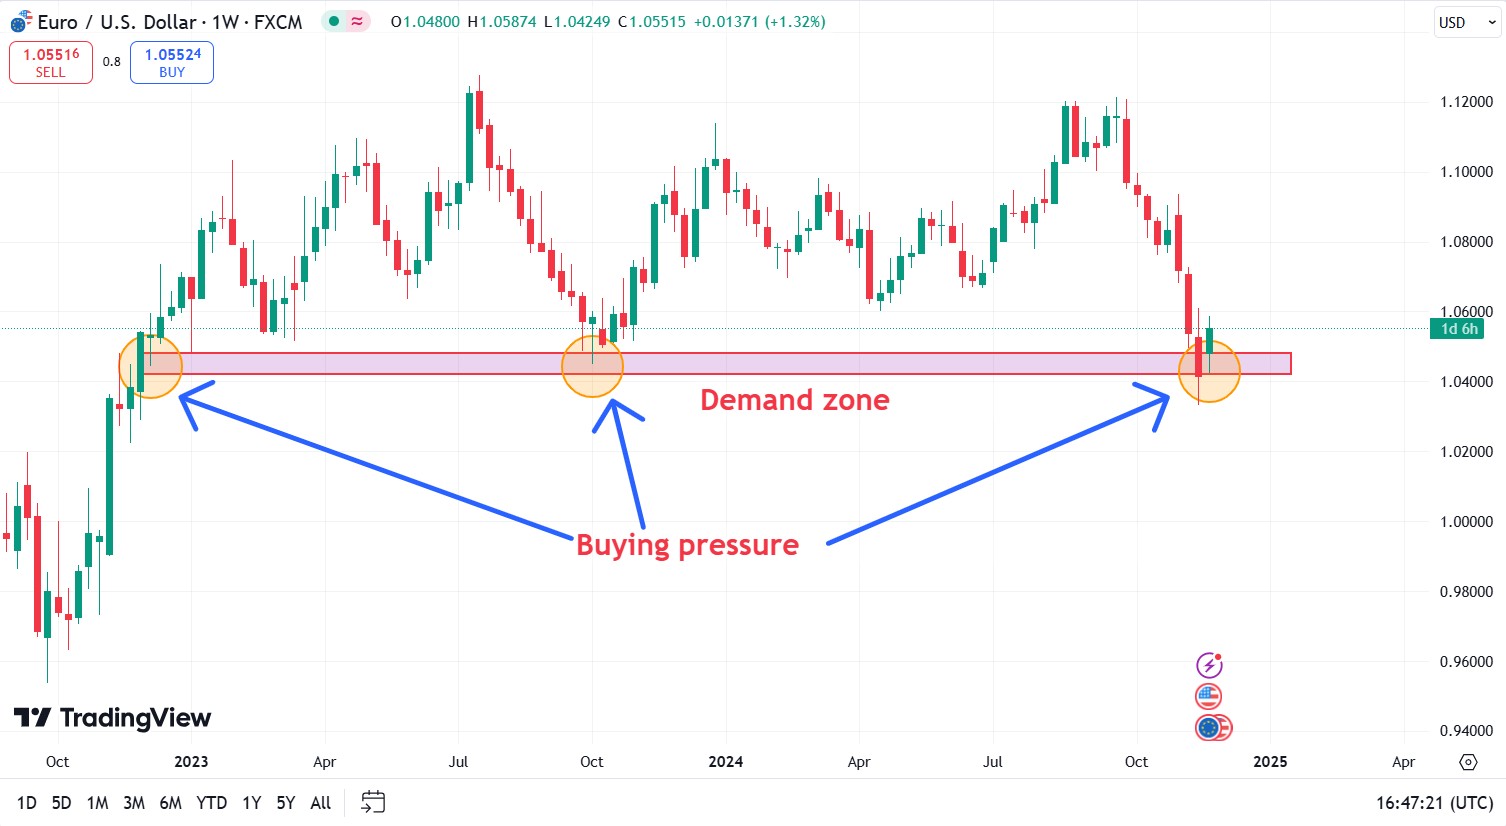
A supply zone is an area where supply exceeds demand, causing the price to fall.
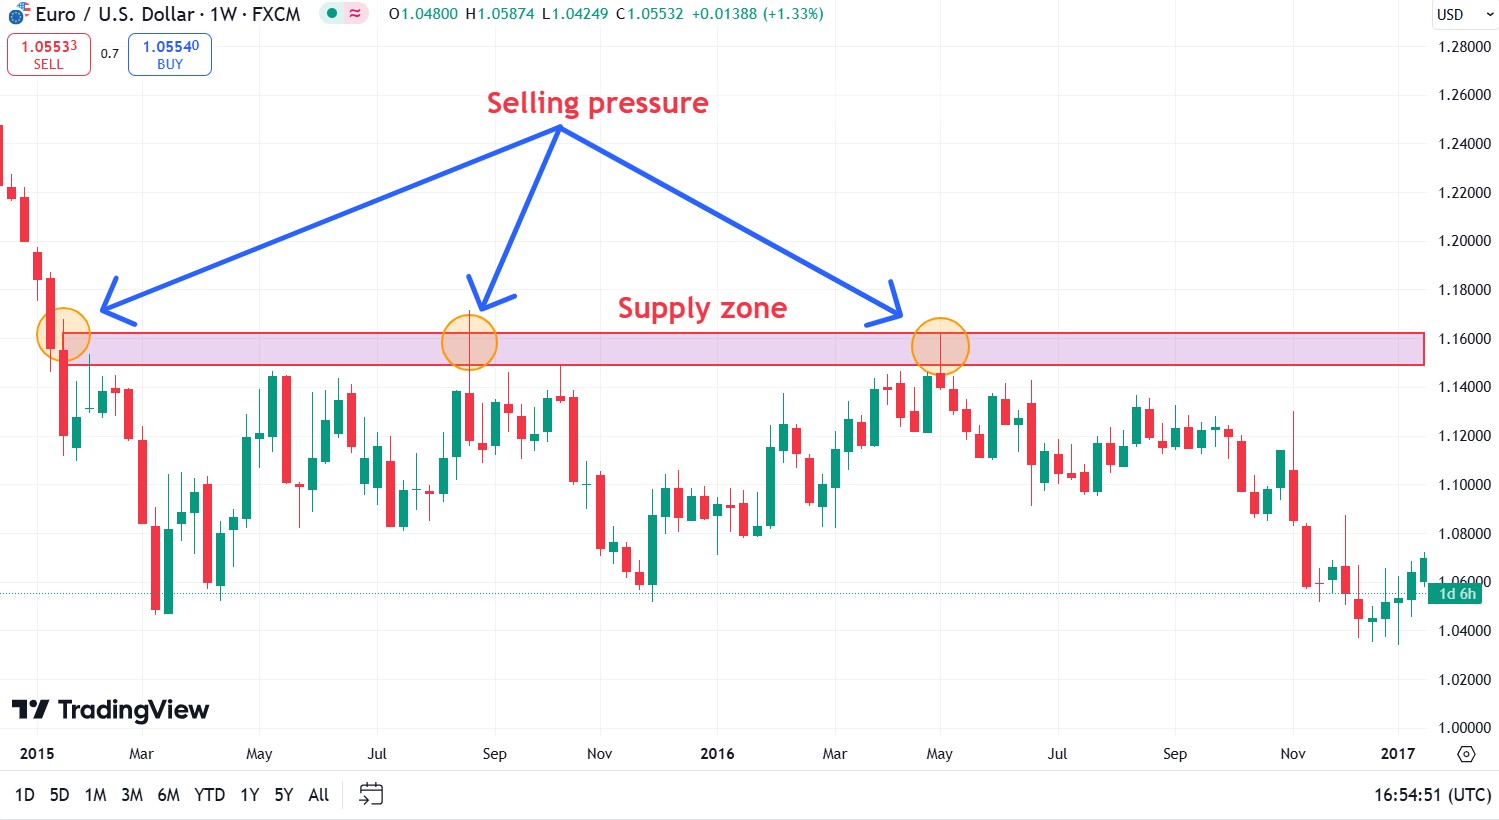
Identifying these zones on the charts involves looking for areas of price consolidation before sharp moves, as well as using volume profiles and other technical indicators to identify areas of high trading volume that may indicate areas of supply or demand.
Psychological aspects of support and resistance levels
Support and resistance levels are formed under the influence of collective behavior of traders. Traders often focus on previous price highs and lows, expecting that the price will react again at these levels. This leads to a concentration of buy orders near support levels and sell orders near resistance levels, reinforcing their importance. Thus, psychological expectations of market participants contribute to the formation and strengthening of these levels.
Market forces in supply and demand zones
Large market participants, such as institutional investors and hedge funds, have a significant influence on the formation of supply and demand zones. When placing large buy or sell orders, they create areas of significant imbalance between supply and demand. These zones become visible on the charts as areas where the price sharply changes direction. Understanding the actions of large players allows traders to identify potential supply and demand zones and make informed trading decisions.
Identification methods on charts
Technical tools for identifying support and resistance levels
Trend lines. Drawn along consecutive highs or lows in price, showing the direction of the trend. An upward trend line connecting consecutive lows can serve as a support level, while a downward line connecting highs can serve as a resistance level. These lines help visualize market dynamics and potential reversal points.
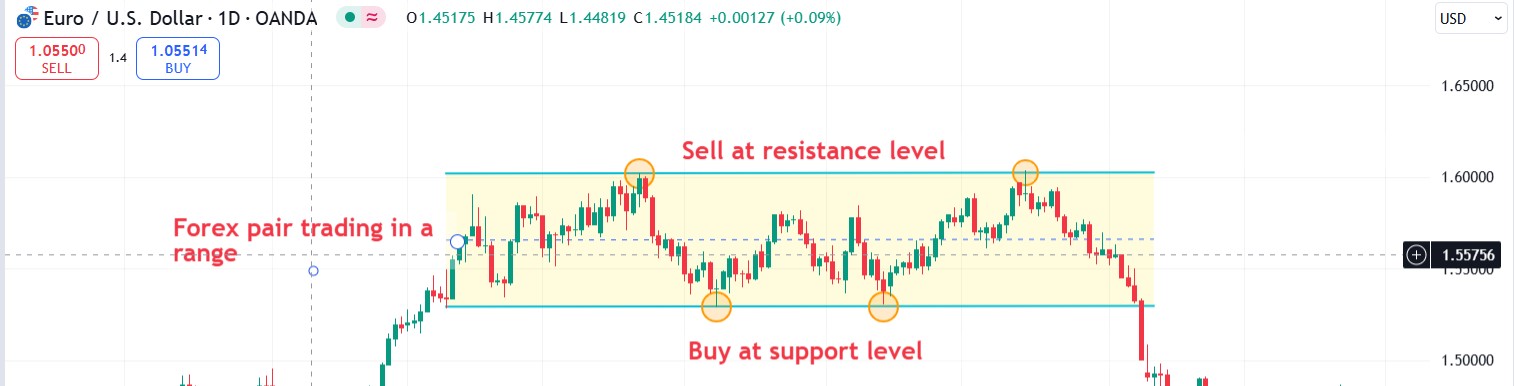
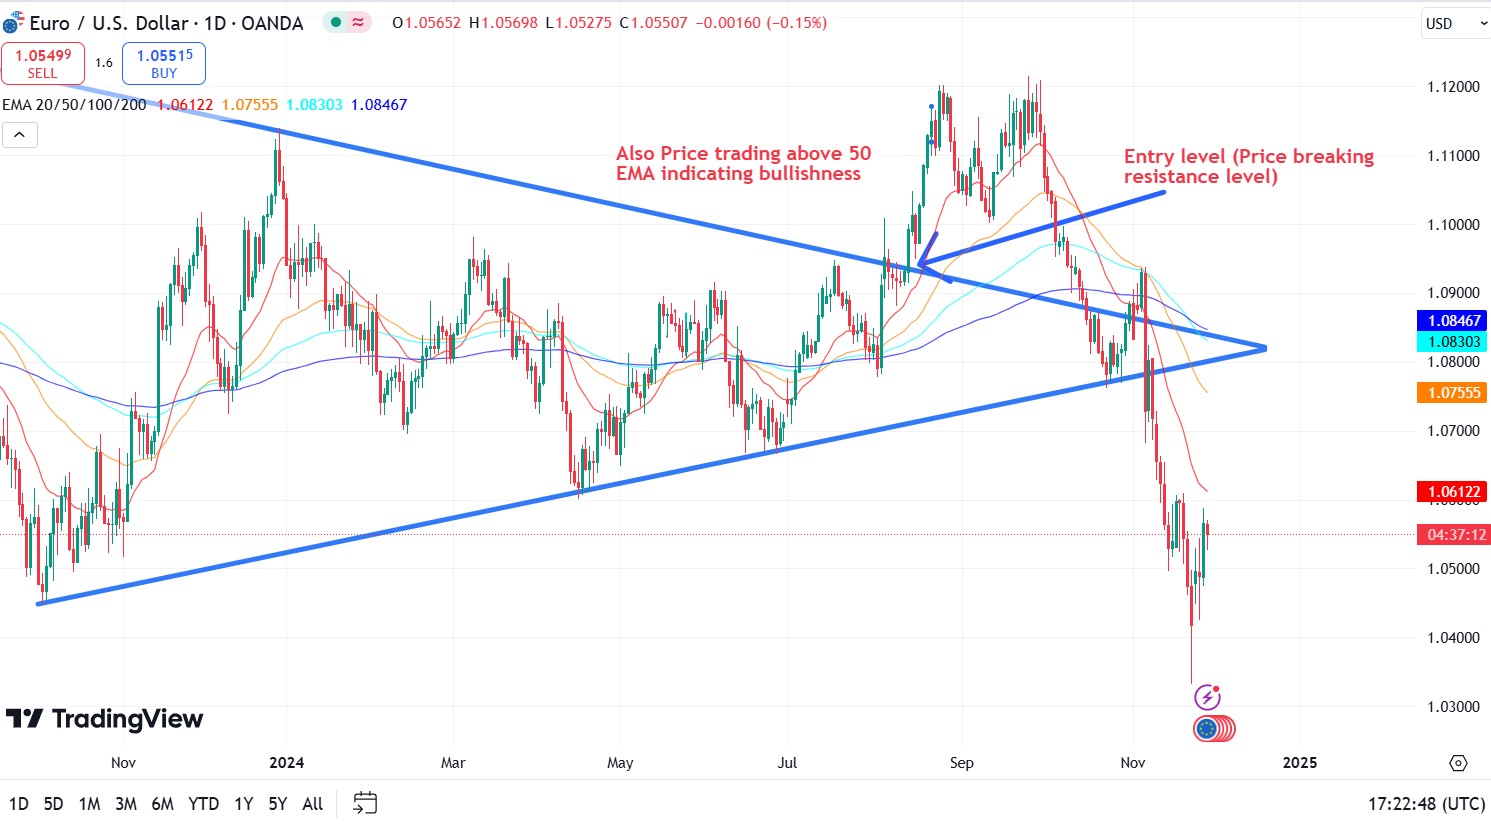
Moving averages. Smooth out price fluctuations by showing the average price of an asset over a certain period. They can act as dynamic support and resistance levels. For example, the price often bounces off a 50-day or 200-day moving average, making them popular benchmarks among traders.
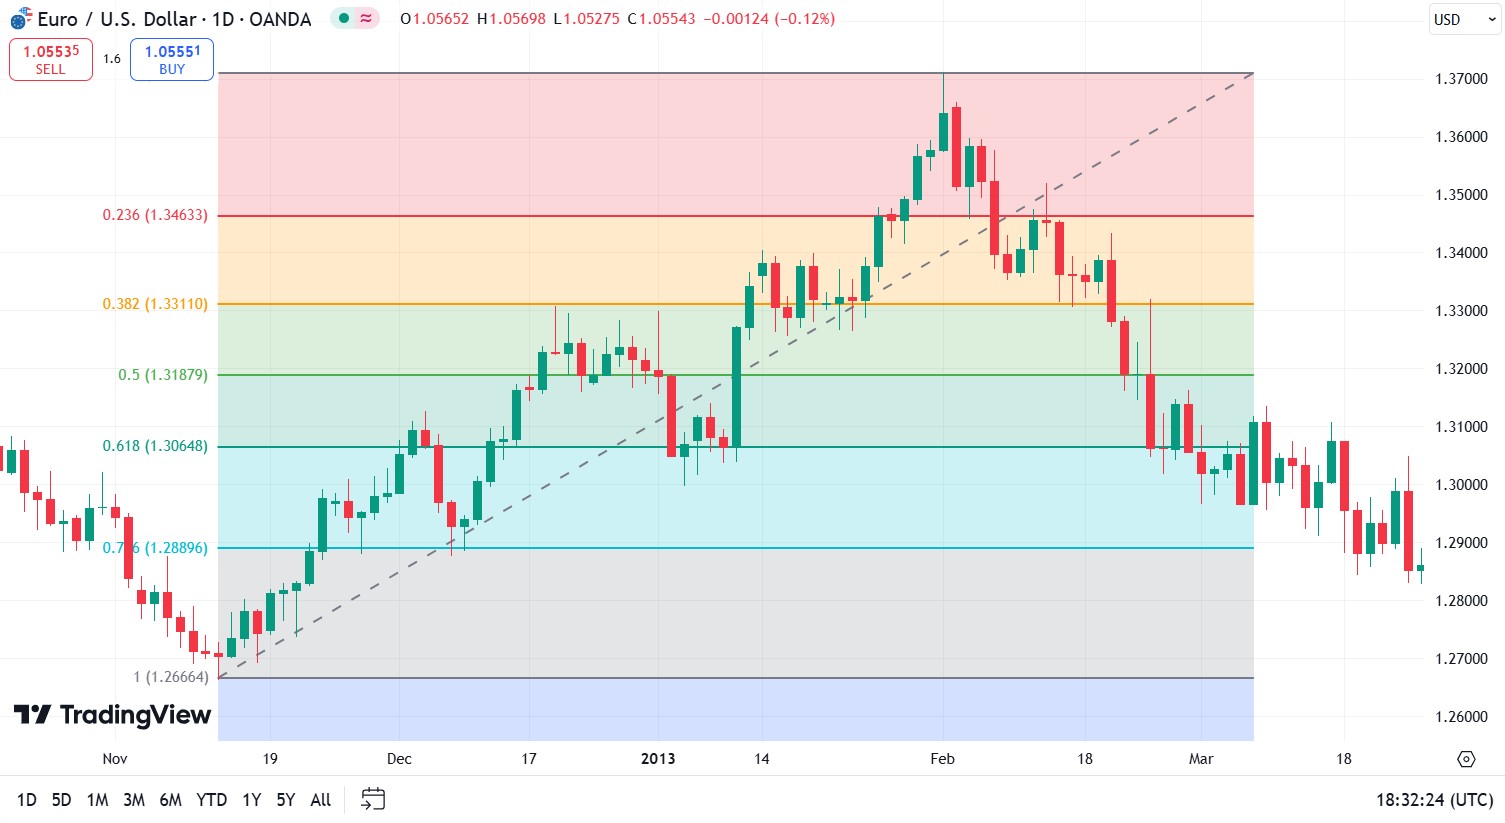
Indicators. Such tools include Fibonacci levels, Pivot Points, and volume indicators. Fibonacci levels are based on mathematical relationships and help identify potential price rollback levels. Pivot Points are calculated based on previous highs, lows, and closes, identifying possible reversal levels. Volume analysis can identify price levels with high trading activity that can act as support or resistance.
Identifying Supply and Demand Zones
Trading volume analysis. High trading volumes at certain price levels can indicate supply or demand zones. Areas with significant buying volumes form demand zones, while areas with predominantly selling volumes form supply zones. Using indicators such as Volume Profile can help identify these zones on the chart.
Price patterns. Certain price patterns such as a double bottom or double top can indicate supply and demand zones. For example, a double bottom often indicates a strong demand zone where the price has failed to break the lower level twice, signaling a possible reversal to the upside.
Candlestick pattern analysis. Candlestick patterns such as a bullish engulfing or bearish harami can indicate the presence of supply and demand zones. These patterns reflect changes in market sentiment and can signal potential price reversals.
Using supply and demand indicators. There are specialized indicators that automatically identify supply and demand zones on the chart, making them easier for the trader to identify.
Practical application in trading
Support and resistance trading strategies
Bounce trading. When the price approaches a support or resistance level, traders expect the price to bounce off this level. A position is entered upon confirmation of a reversal, for example, using candlestick patterns or oscillators. Stop loss is placed behind the level to limit potential losses. Take profit is set at the nearest opposite level or depending on the risk to reward ratio.
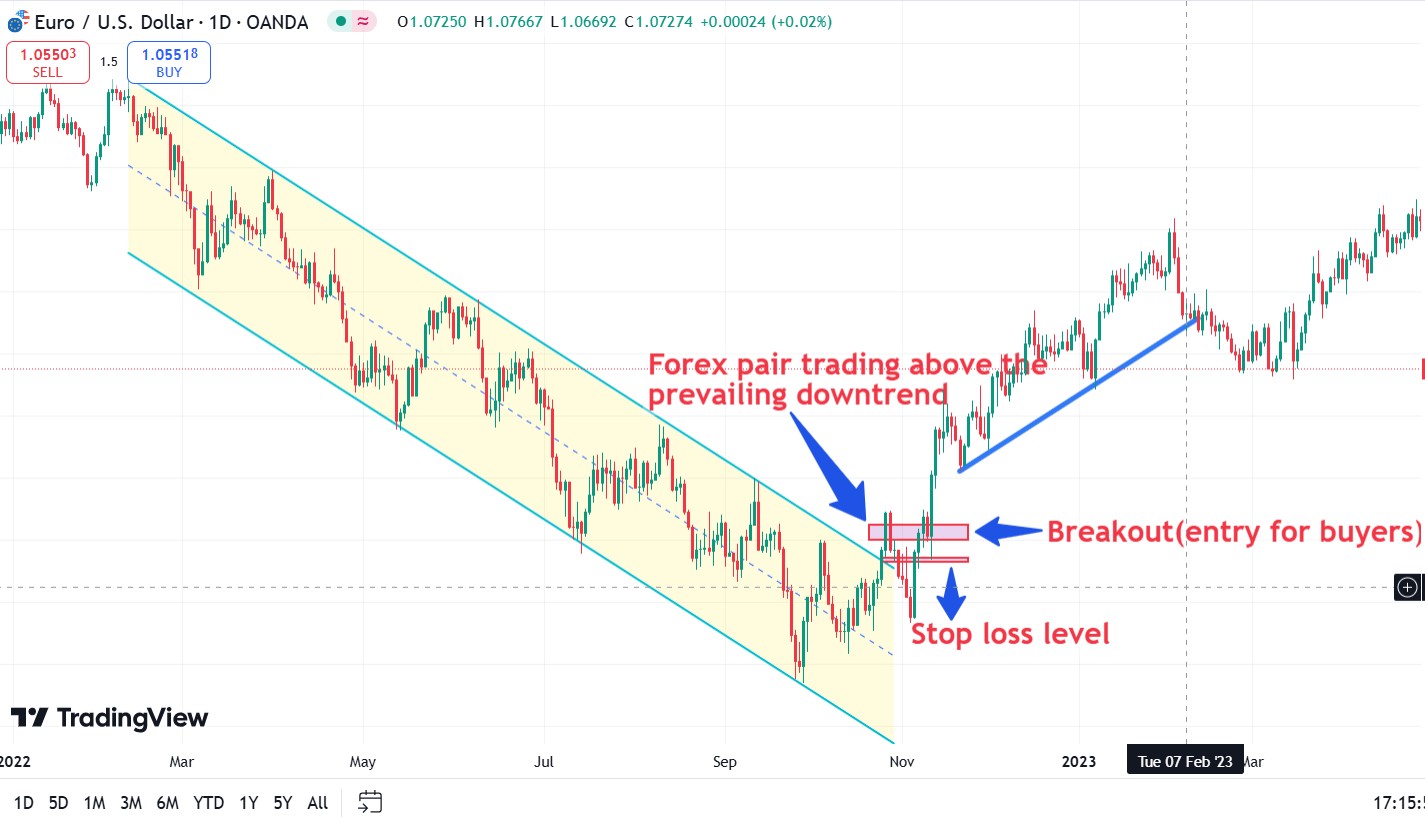
Breakout trading. If the price breaks through a support or resistance level, this may signal a continuation of the trend. A position is entered upon confirmation of the breakout, for example, when a candle closes behind the level or the trading volume increases. Stop loss is placed below (for long positions) or above (for short positions) the broken level. Take profit is determined based on the next significant level or taking into account the volatility of the asset.
Trading with Supply and Demand Zones
Defining zones. Supply and demand zones are identified on the chart as areas where sharp price movements accompanied by high trading volumes have been observed in the past. These zones indicate the activity of large market participants.
Entering a position. When the price approaches the demand zone, traders consider opening long positions, expecting the price to rise. When approaching the supply zone, they consider opening short positions in anticipation of a price decline. Candlestick patterns, oscillator divergences, or other technical signals serve as confirmation.
Risk management. Stop loss is placed outside the demand or supply zone to minimize losses in the event of an unfavorable price movement. Take profit is set based on the nearest resistance or support levels, or taking into account the expected price movement.
You also need to find a reliable broker to test your strategies with. We have studied the conditions on the best trading platforms and prepared a comparison table.
| Demo | Min. deposit, $ | Max. leverage | Min Spread EUR/USD, pips | Max Spread EUR/USD, pips | ECN Commission | ECN Spread EUR/USD | Open an account | |
|---|---|---|---|---|---|---|---|---|
| Yes | 10 | 1:1000 | 0.1 | 0.4 | 7 | 0.1 | Go to broker Your capital is at risk.
|
|
| Yes | 100 | 1:300 | 0.5 | 0.9 | No | No | Go to broker 80% of retail CFD accounts lose money. |
|
| Yes | No | 1:200 | 0.1 | 0.5 | 3.5 | 0.15 | Go to broker Your capital is at risk. |
|
| Yes | 50 | 1:50 | 0.9 | No | No | No | Go to broker Your capital is at risk. |
|
| Yes | 100 | 1:50 | 0.7 | 1.2 | 5 | 0.2 | Study review |
Don't forget to backtest your strategies

In trading, supply and demand zones help identify areas where the price is most likely to change direction. However, to improve the accuracy of your analysis, you should consider the depth of the zones. For example, instead of a simple horizontal line, use a price range that reflects the activity of large market participants. This will help avoid false signals when retesting the zones.
Use trading volumes to strengthen entry points. If the volumes in a demand zone are growing on an uptrend, this confirms the activity of buyers. Conversely, a decrease in volume when approaching a zone may signal market weakness. Combining zones with indicators such as RSI or MACD provides additional confirmation for decision making.
Don't forget to backtest your strategies. This allows you to understand how a specific supply or demand zone has affected past price movements. This approach will improve your zone identification skills and reduce the likelihood of errors when using these tools in real trades.
Conclusion
Mastering the interplay between supply and demand zones and support and resistance levels is crucial for effective market analysis and trading success. While support and resistance offer clear price barriers based on historical data, supply and demand zones provide deeper insight into market psychology and potential turning points. For example, anticipating a reversal when price hits a strong demand zone, even if it breaks a previous support level, can yield significant trading opportunities. Ultimately, integrating both concepts allows traders to make more informed, confident decisions. Remember, those who skillfully combine these tools position themselves ahead of the market, turning uncertainty into strategic advantage.
FAQs
What are the main challenges in accurately identifying supply and demand zones compared to support and resistance levels?
How do psychological factors differ between support and resistance levels and supply and demand zones?
Can price patterns and candlestick analysis be used with both supply and demand zones and support and resistance levels?
Why is it important to use a price range rather than a single horizontal line when mapping supply and demand zones?
Editors' Top Picks and Insights

The privacy paradox: How the crypto mixer market has changed

Is Bitcoin right for you? Five traits shared by many cryptocurrency holders

Chasing hits: Why investors are losing interest in Netflix

Tokenized stocks in the spotlight: How do they work and are they worth trading?

Do politicians make the best stock traders?

Crypto test drive: How automakers are exploring digital assets
Related Articles
Team that worked on the article
Maxim Nechiporenko has been a contributor to Traders Union since 2023. He started his professional career in the media in 2006.
Dan Blystone began his trading career in 1998 as an arbitrage clerk on the floor of the Chicago Mercantile Exchange (CME). He later traded bond and Eurex futures at proprietary firms such as Altea Trading, gaining valuable experience in high-frequency trading and risk management.
Chinmay Soni is a financial analyst with more than 5 years of experience in working with stocks, Forex, derivatives, and other assets. As a founder of a boutique research firm and an active researcher, he covers various industries and fields, providing insights backed by statistical data.
An investor is an individual, who invests money in an asset with the expectation that its value would appreciate in the future. The asset can be anything, including a bond, debenture, mutual fund, equity, gold, silver, exchange-traded funds (ETFs), and real-estate property.
Take-Profit order is a type of trading order that instructs a broker to close a position once the market reaches a specified profit level.
In trading, a supply and demand zone refers to specific price levels on a chart where there is an imbalance between buyers (demand) and sellers (supply). A demand zone represents a price area where buying interest is strong, potentially leading to price increases, while a supply zone indicates an area where selling interest is significant, possibly resulting in price declines.
Uptrend is a market condition in which prices are generally rising. Uptrends can be identified by using moving averages, trendlines, and support and resistance levels.
Forex trading, short for foreign exchange trading, is the practice of buying and selling currencies in the global foreign exchange market with the aim of profiting from fluctuations in exchange rates. Traders speculate on whether one currency will rise or fall in value relative to another currency and make trading decisions accordingly. However, beware that trading carries risks, and you can lose your whole capital.

-
 Afghanistan
-
 Albania
-
 Algeria
-
 Angola
-
 Argentina
-
 Armenia
-
 Australia
-
 Austria
-
 Azerbaijan
-
 Bahamas
-
 Bahrain
-
 Bangladesh
-
 Belarus
-
 Belgium
-
 Bolivia
-
 Botswana
-
 Brazil
-
 Brunei
-
 Bulgaria
-
 Cambodia
-
 Cameroon
-
 Canada
-
 Chile
Chile
-
 China
China
-
 Colombia
-
 Congo
Congo
-
 Costa Rica
-
 Cote d'Ivoire
-
 Croatia
-
 Cuba
Cuba
-
 Cyprus
-
 Czechia
-
 DR Congo
-
 Denmark
-
 Dominican Republic
-
 Ecuador
-
 Egypt
Egypt
-
 El Salvador
-
 Estonia
-
 Eswatini
-
 Ethiopia
-
 Finland
-
 France
-
 Georgia
-
 Germany
-
 Ghana
Ghana
-
 Greece
-
 Haiti
Haiti
-
 Hong Kong
-
 Hungary
-
 India
India
-
 Indonesia
-
 Iran, Islamic republic
-
 Iraq
Iraq
-
 Ireland
-
 Israel
-
 Italy
Italy
-
 Jamaica
-
 Japan
Japan
-
 Jordan
-
 Kazakhstan
-
 Kenya
Kenya
-
 Korea
Korea
-
 Kuwait
-
 Kyrgyzstan
-
 Laos
Laos
-
 Latvia
-
 Lebanon
-
 Lesotho
-
 Libya
Libya
-
 Lithuania
-
 Luxembourg
-
 Madagascar
-
 Malaysia
-
 Malta
Malta
-
 Mauritius
-
 Mexico
-
 Moldova
-
 Mongolia
-
 Montenegro
-
 Morocco
-
 Mozambique
-
 Myanmar
-
 Namibia
-
 Nepal
Nepal
-
 Netherlands
-
 New Zealand
-
 Nigeria
-
 North Macedonia
-
 Norway
-
 Oman
Oman
-
 Pakistan
-
 Palestine
-
 Panama
-
 Papua New Guinea
-
 Paraguay
-
 Peru
Peru
-
 Philippines
-
 Poland
-
 Portugal
-
 Puerto Rico
-
 Qatar
Qatar
-
 Reunion
-
 Romania
-
 Rwanda
-
 Saudi Arabia
-
 Serbia
-
 Singapore
-
 Slovakia
-
 Slovenia
-
 Somalia
-
 South Africa
-
 Spain
Spain
-
 Sri Lanka
-
 Sweden
-
 Switzerland
-
 Syria
Syria
-
 Taiwan
-
 Tajikistan
-
 Tanzania
-
 Thailand
-
 Trinidad and Tobago
-
 Tunisia
-
 Turkey
-
 UAE
UAE
-
 Uganda
-
 Ukraine
-
 United Kingdom
-
United States
-
 Uruguay
-
 Uzbekistan
-
 Venezuela
-
 Vietnam
-
 Yemen
Yemen
-
 Zambia
-
 Zimbabwe
- Forex
- Crypto











