How To Use Pivot Points In Forex Trading Effectively | Full Guide


Editorial Note: While we adhere to strict Editorial Integrity, this post may contain references to products from our partners. Here's an explanation for How We Make Money. None of the data and information on this webpage constitutes investment advice according to our Disclaimer.
The Pivot point is used to determine the price level in a given situation. It shows the level of support or resistance, thanks to which you can determine the direction of price movement or determine the trend. The Pivot point is one of the leading tools for technical analysis.
In the financial markets, numbers and movements matter a lot, so investors are constantly looking for reliable tools to analyze the market. and make informed decisions. One such tool is pivot points, with their simple but powerful calculations. They often play a key role in a Forex trader's arsenal and beyond. In this article, the professionals at Traders Union look at how pivot points work, why they are so important to traders, and how they can help you achieve financial success.
What is a Pivot point?
The pivot point is a concept used in various fields ranging from business to physics. In the context of finance and trading, the pivot point is used to identify key price levels in various market situations. It represents a level that is considered important in determining the direction or change of a market trend. The pivot point is one of the main tools in technical analysis, helping traders make informed decisions about their trades.
Pivot point calculation is based on mathematical formulas that are used to determine the center point or price level. There are several different methods of calculating pivot points, but the most common are based on the high, low and closing price of the previous period. Based on this center point, additional support and resistance levels are calculated, which the trader uses to determine potential profit targets. A trader can use different time intervals to calculate pivot points depending on the traded asset and current market volatility.
The pivot point and the corresponding support and resistance levels are used by traders to make entry and exit decisions. For example, when the price approaches a support level, a trader may view this as an opportunity to open a buy position, waiting for the price to rebound. On the other hand, when the price reaches a resistance level, a trader may consider this as a signal to close a position or open a short position, expecting the price to decline.
Before applying pivot-point strategies in live trading, it’s important to choose a reliable broker that offers stable execution, transparent pricing, and platforms where technical tools work smoothly. The comparison table below highlights reputable Forex brokers that provide suitable conditions for traders who actively rely on Pivot Points.
| zForex | Plus500 | Trading.com USA | OANDA | FOREX.com | |
|---|---|---|---|---|---|
|
Min. deposit, $ |
10 | 100 | 50 | No | 100 |
|
Max. leverage |
1:1000 | 1:300 | 1:50 | 1:200 | 1:50 |
|
Standard EUR/USD spread |
0.3 | 0.7 | 1.1 | 0.3 | 1.0 |
|
Deposit fee, % |
No | No | No | No | No |
|
Withdrawal fee, $ |
No | No | No | 0-15 | No |
|
Withdrawal fee, % |
No | No | No | No | No |
|
Max. Regulation Level |
Not regulated | Tier-1 | Tier-1 | Tier-1 | Tier-1 |
|
TU overall score |
7.89 | 7.52 | 6.81 | 6.8 | 6.74 |
|
Open an account |
Go to broker Your capital is at risk.
|
Go to broker 80% of retail CFD accounts lose money. |
Go to broker Your capital is at risk. |
Go to broker Your capital is at risk. |
Study review |
Types of Pivot Points
There are several different types of pivot points that have their own peculiarities and are used in different trading strategies. TU specialists will tell you about each of them in detail.
Classic Pivot Point
The most common type of pivot point, which is calculated on the basis of high, low prices and the closing price of the previous trading period. The classic pivot point acts as a central point against which support and resistance levels are calculated.
It is calculated as the arithmetic mean between the high, low and closing price of the previous trading period, which gives the main point (Pivot Point). After the pivot point is calculated, support and resistance levels are determined based on the difference between the high and low prices of the previous period.
The same basic formula is used to set pivot points for both short and long positions in the Forex market, but with different entry and exit levels depending on the direction of trading.
Setting pivot points for a short position:
Pivot Point (PP):
PP=(H+L+C)/3,
where H is the highest price of the previous period,
L - the lowest price of the previous period,
C - closing price of the previous period.
Resistance levels (R) for a short position:
R1: R1=(2×PP)-L
R2: R2=PP+(H-L)
R3: R3=H+2×(PP-L)
Setting pivot points for a long position:
Pivot Point (PP):
S1: S1=(2×PP)-H
PP=(H+L+C)/3,
where H is the highest price of the previous period,
L - the lowest price of the previous period,
C - closing price of the previous period.
Resistance (R) levels for a long position:
R1: R1=(2×PP)−L
R2: R2=PP+(H−L)
R3: R3=H+2×(PP−L)
Support (S) levels for a long position:
S1: S1=(2×PP)−H
S2: S2=PP−(H−L)
S3: S3=L−2×(H−PP)
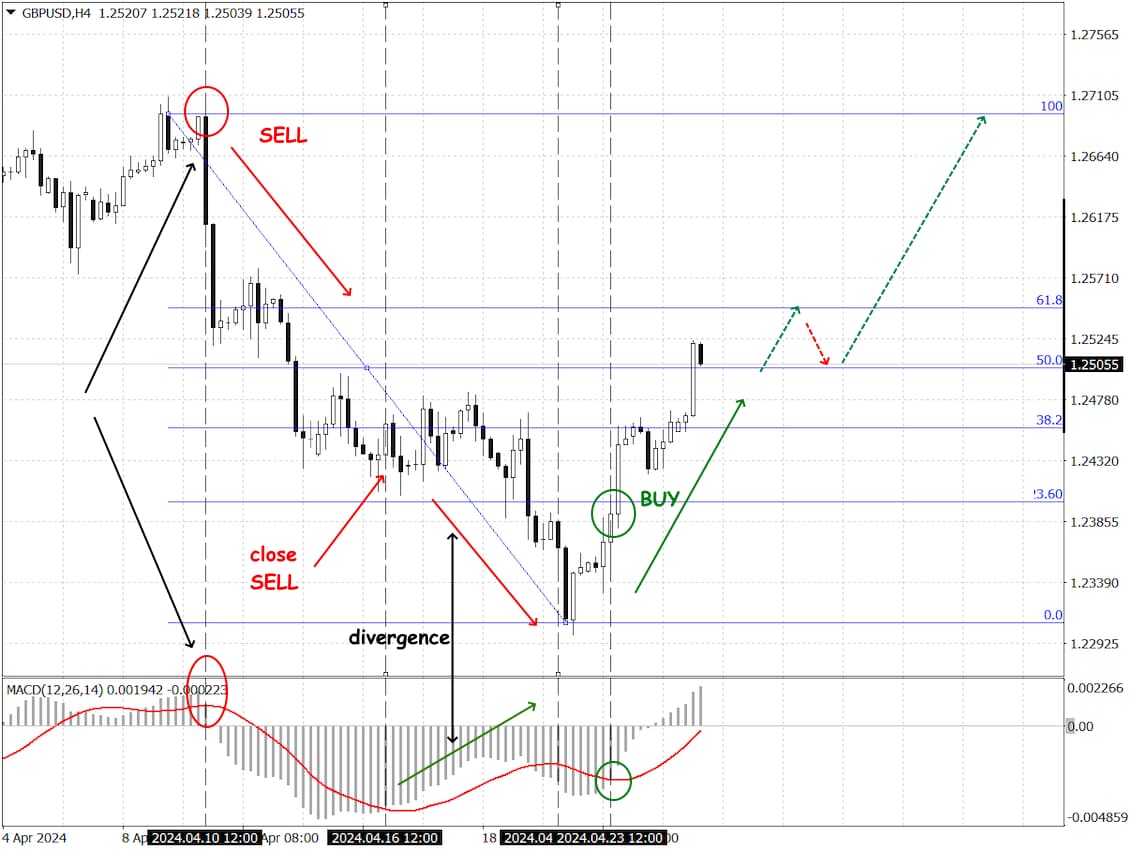
An example of using Pivot points in the Forex market:
Let's consider the chart of the currency pair GBP/USD on the hourly time interval.
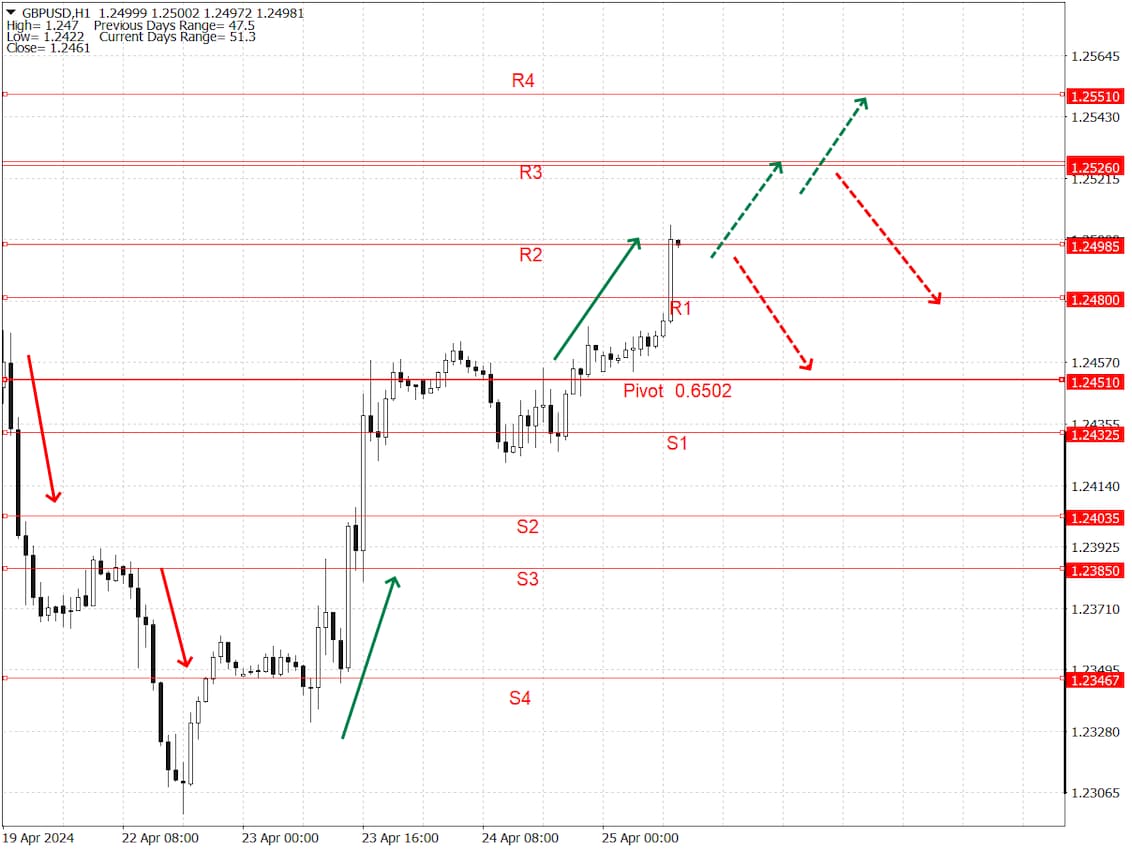
The price clearly unfolds near the calculated levels, especially since additional price zones can be constructed using a similar formula.
Using these levels, a trader can make decisions on entering and exiting GBP/USD deals based on expected support and resistance levels.
Please note: at Pivot levels the market can turn in any direction - you must use additional signals to make a decision, but in Pivot zones you can place Take Profit, Stop Loss, or Stop/Limit pending orders.
- Pros
- Cons
- Simplicity of calculation. The calculation of the classic pivot point is based on a simple formula, which makes it easily accessible to all traders.
- Widespread use. The classic pivot point is the most common type and is widely used in trading strategies.
- Does not take volatility into account. The classic pivot point does not take market volatility into account in its calculation, which can lead to underestimation of support and resistance levels during periods of high volatility.
- Limited adaptability. This method does not adapt to changes in market dynamics and therefore is not sufficiently effective in volatile conditions.
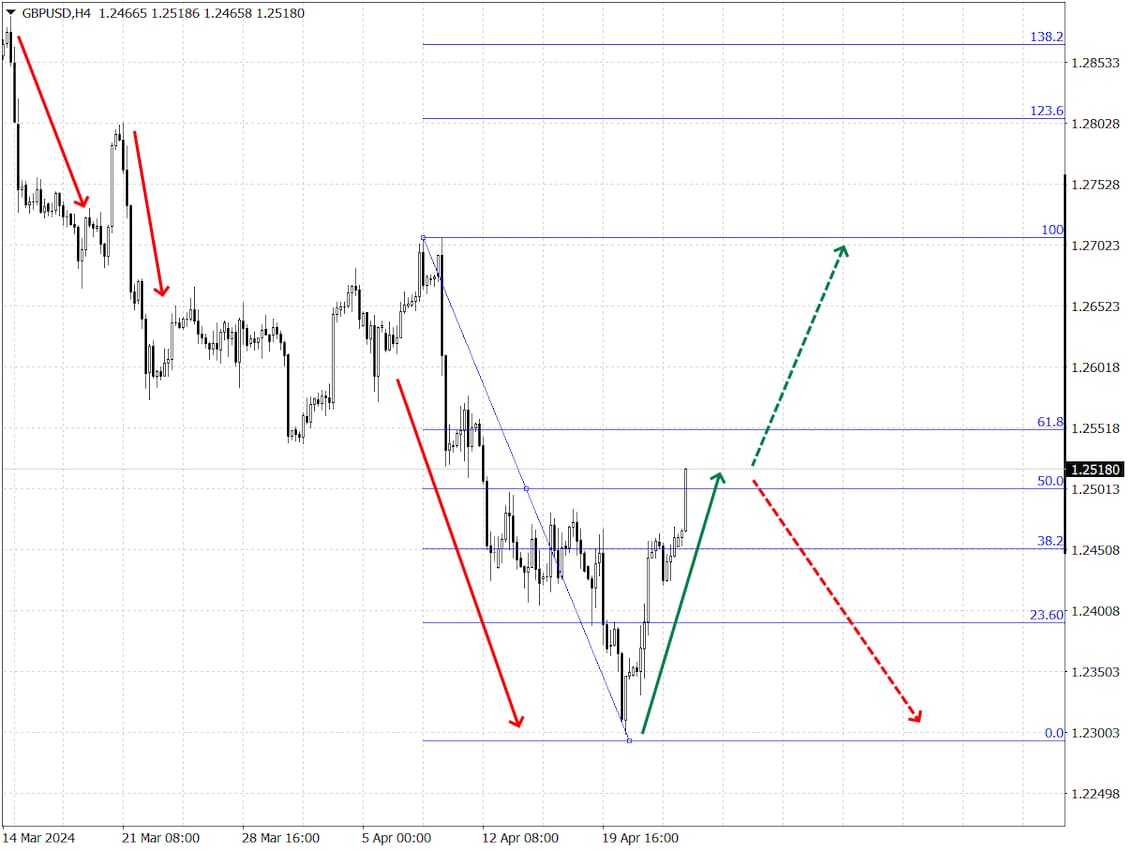
Fibonacci Pivot Point
This type of pivot point is based on Fibonacci levels, which are used to calculate price levels. In this method, the pivot point and support and resistance levels are calculated based on Fibonacci levels, which are defined as percentages of the difference between the high and low prices of the previous period. Fibonacci levels can be 23.6%, 38.2%, 50%, 61.8% and 100%.
The calculation of Fibonacci levels begins by determining the difference between the high and low prices of the previous trading period. This range is then multiplied by certain Fibonacci levels (usually 23.6%, 38.2%, 50%, 61.8%, 100%) and added to the closing price (C) to obtain support (S) and resistance (R) levels:
S=C−(H−L)×Fibonacci
R=C+(H−L)×Fibonacci
Example:
If the difference between the high and low prices is 10, then the 38.2% Fibonacci support level would be 3.82 and the 61.8% resistance level would be 6.18.
- Pros
- Cons
- Accounting for Fibonacci levels. Using Fibonacci levels helps identify support and resistance areas based on significant percentages.
- Flexibility. The method is considered highly adaptable to different market conditions.
- Calculation complexity. Calculating Fibonacci pivot points is more complex than classical ones and requires knowledge.
DeMark Pivot Point
The method uses an alternative approach to calculating the pivot point, which is based on the ratio of maximum and minimum prices for a certain period of time. Support and resistance levels are calculated based on this ratio.
DeMark Pivot Point (PP) is calculated based on the ratio of maximum (H) and minimum (L) prices for a certain period of time:
PP=(H+L+2×L+2×C)/4
if (Close < Open), then Pivot=High + 2 × Low + Close,
if (Close > Open), then Pivot = 2 × High + Low + Close,
if (Close = Open), then Pivot = High + Low + 2 × Close.
New support level S1 = Pivot / 2 - Low,
New resistance level R1 = Pivot / 2 + High, where
high - maximum of the previous day;
low - the minimum of the previous day;
close - closing price of the previous day.
Example:
To calculate the pivot point according to DeMark, special formulas are used that take into account current and previous prices (see below).

- Pros
- Cons
- Alternative approach. DeMark Pivot Point offers an alternative calculation method, which can be useful for traders looking for variety in their approach.
- Accounting for current prices. This method takes current prices into account, making it more adaptive to current market conditions.
- Calculation complexity. Calculation of pivot points by DeMark is complicated and requires additional tools.
- Limited prevalence. DeMark Pivot Points are not so common, which sometimes makes it difficult to share information and strategies with other traders.
Woodie's Pivot Point
This pivot point indicator focuses on the average price rather than the closing price of the previous period. The center point is defined as the average between the high and low prices rather than the average between the high, low and closing prices. Support and resistance levels are also calculated differently, which makes the method unique.
Pivot = (High + Low + 2 × Close) / 4
Resistance Level (R1) = 2 × Pivot - Low
R2 = Pivot + High - Low
Support level (S1) = 2 × Pivot - High
S2 = Pivot - High + Low
Example:
- Pros
- Cons
- Accounting for the average price. This method takes into account the average price, which may be more representative of certain markets or assets.
- Greater flexibility. Woodie's Pivot Point can be more flexible and adaptive to certain trading strategies.
- Limited use. Woodie's Pivot Point is less common and less recognized in trade communities.
Camarilla Pivot Point
A complex method uses four support and four resistance levels, which are calculated based on previous market volatility. The pivot point in this case serves as the center point against which the other levels are calculated.
Example:
The calculation of Camarilla Pivot Point levels based on previous market volatility. An example of their use can be found in specialized sources.
Formulas for calculating levels in Camarilla Pivot Point are quite complicated, an example of their use can be found in specialized sources. But in the network you can find special indicators that will build such levels automatically.
- Pros
- Cons
- Volatility accounting. Camarilla Pivot Point takes into account previous volatility, which can make it more adaptive to changes in the market.
- Extremely high complexity of calculation. Calculation of Camarilla Pivot levels requires special knowledge and tools.
- Unpopularity. Camarilla Pivot points are used infrequently, which makes it very difficult to find and process information.
These are the basic methods for calculating each type of Pivot Point. When using any of these methods, it is important to take into account the specifics of the market and the appropriate calculation time.
How to Use Pivot Points in Forex Trading Effectively?
The pivot point trading strategy is a powerful tool for Forex traders, helping them to identify potential support and resistance levels on price charts. In Forex trading, pivot points are widely used in the following popular strategies:
Trading at support and resistance levels. Traders use support and resistance levels calculated on the basis of pivot points to determine when to enter a trade or set stop losses and take profits;
Trading bounces from levels. Market participants can wait for the price to reach support or resistance levels and look for signals for a price bounce from these levels;
Trading breakouts of levels. Traders wait for a breakdown of support or resistance levels and enter a trade when the breakdown is confirmed.
In addition, pivot points can be combined with other technical indicators to confirm trading signals. For example, a trader uses pivot points in combination with MACD or RSI indicators to confirm buy or sell signals. Confirming signals from multiple indicators can increase the probability of a successful trade.
Using pivot points as levels to set targets for closing a position (take profit) is also common in Forex trading. Traders choose moments to close a position at support or resistance levels calculated on the basis of pivot points.
Tips for beginner traders
TU experts advise beginners on how to use pivot points in Forex trading to make money rather than lose money.
1. Understand the basic concepts. Before using pivot points, traders need to make sure they understand the main concepts of support and resistance. Pivot points are based on these principles. And even after being experienced, a trader should continue to study different aspects of the market using pivot points. And it is better to start with basic calculations, using a simple method of classical pivot points. It is the most transparent and understandable for beginners.
2. Practice with historical data. Before you start trading on a real account, it is advisable to try to apply pivot points to historical data and test their effectiveness on different currency pairs. You should not forget about the importance of practice. Mastering this skill is crucial for achieving success in Forex trading. You should regularly train on a demo account, apply knowledge about pivot points, and analyze the results of transactions, constantly improving your skills.
3. Use other indicators in combination. To improve the accuracy of trading signals, traders should consider combining pivot points with other technical indicators such as RSI or MACD. It is also important to be flexible: pivot points can change during the trading day or week, so be prepared to adapt strategies according to new information.
4. Pay attention to time. Be sure to consider the time frame when applying pivot points. Some traders prefer to use daily levels, while others work at intraday or weekly levels. Timeframes should be determined carefully, remembering that pivot points are calculated based on previous price data. The trader must be sure to choose the right interval that suits his style and trading objectives.
5. Apply an entry strategy and observe risk discipline. It is advisable for a trader to develop a market entry strategy based on pivot point signals. For example, entering a trade when the price bounces from the support or resistance level. For risk management it is important to set stop-loss and take-profit on the basis of levels calculated with the help of pivot points.
Following these tips will help beginners to effectively use pivot points in Forex trading and develop their trading skills.
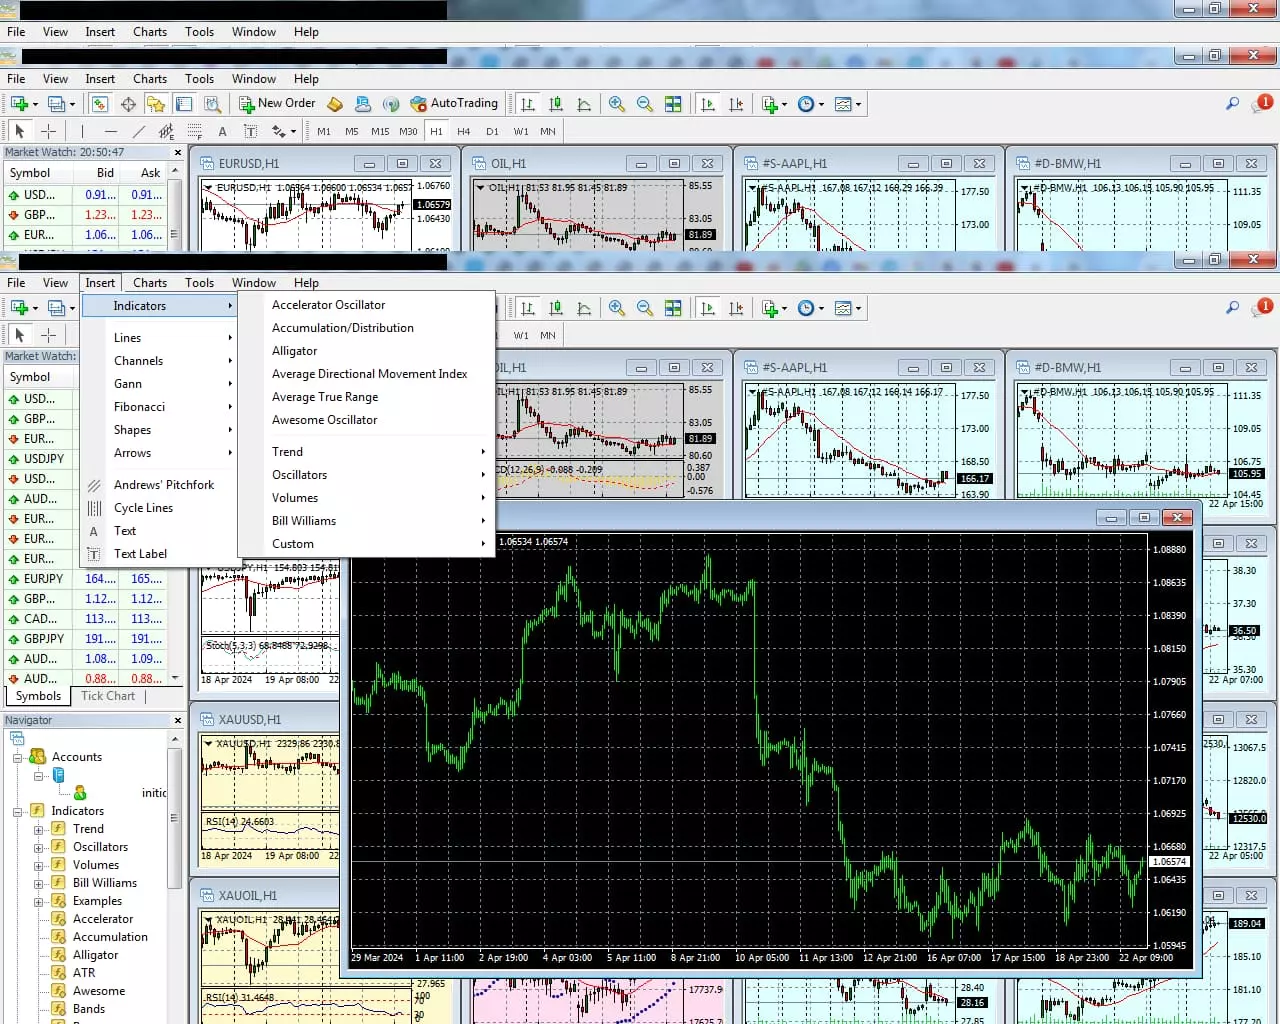
How to add the Pivot Points indicator to MT4?
MetaTrader4 is currently the most popular for Forex trading. Traders Union experts give a step-by-step guide on how to add Pivot Points indicator to MT4:
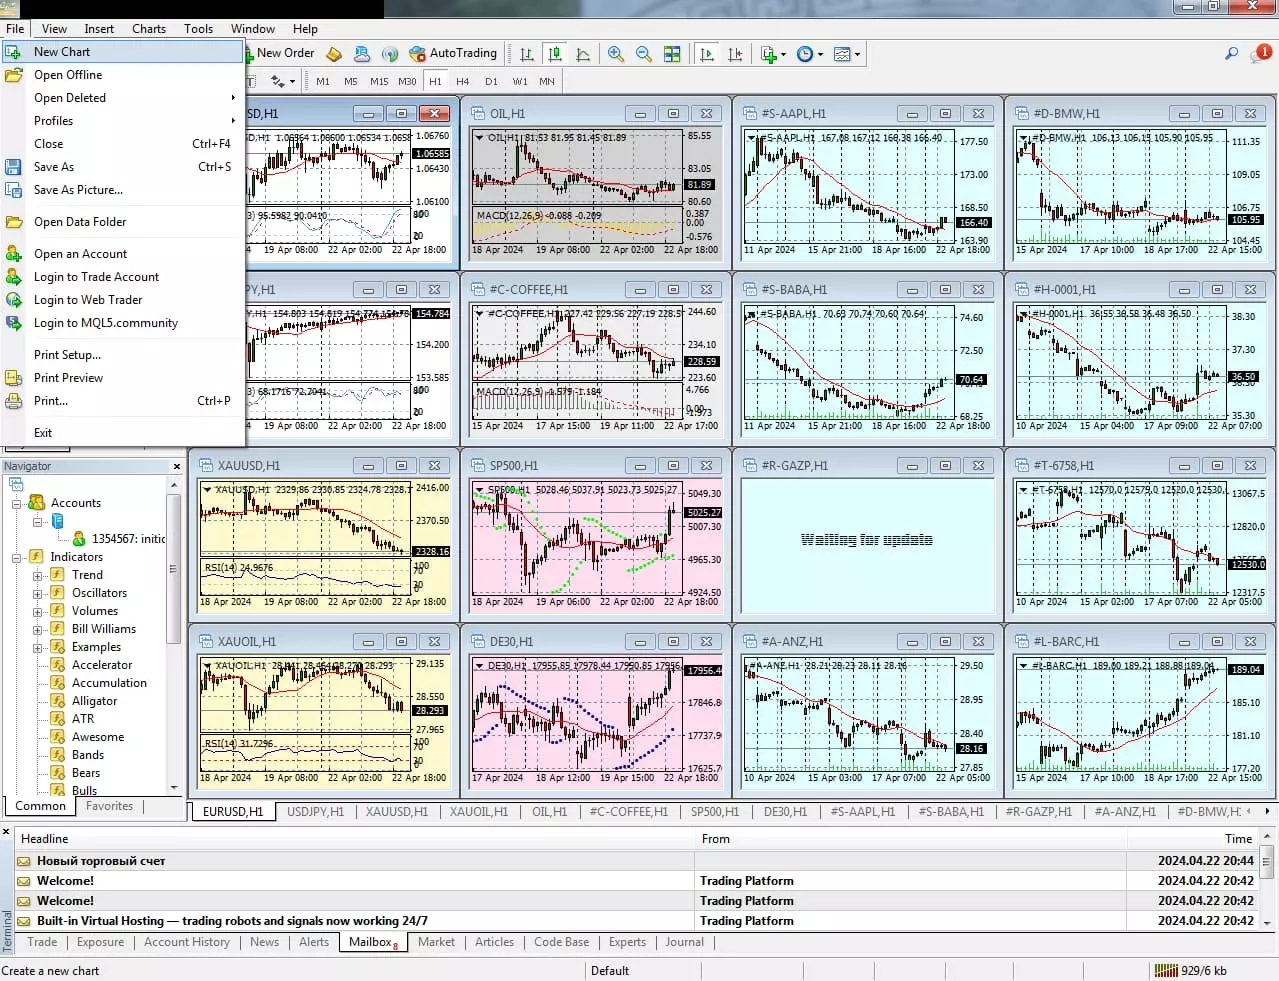
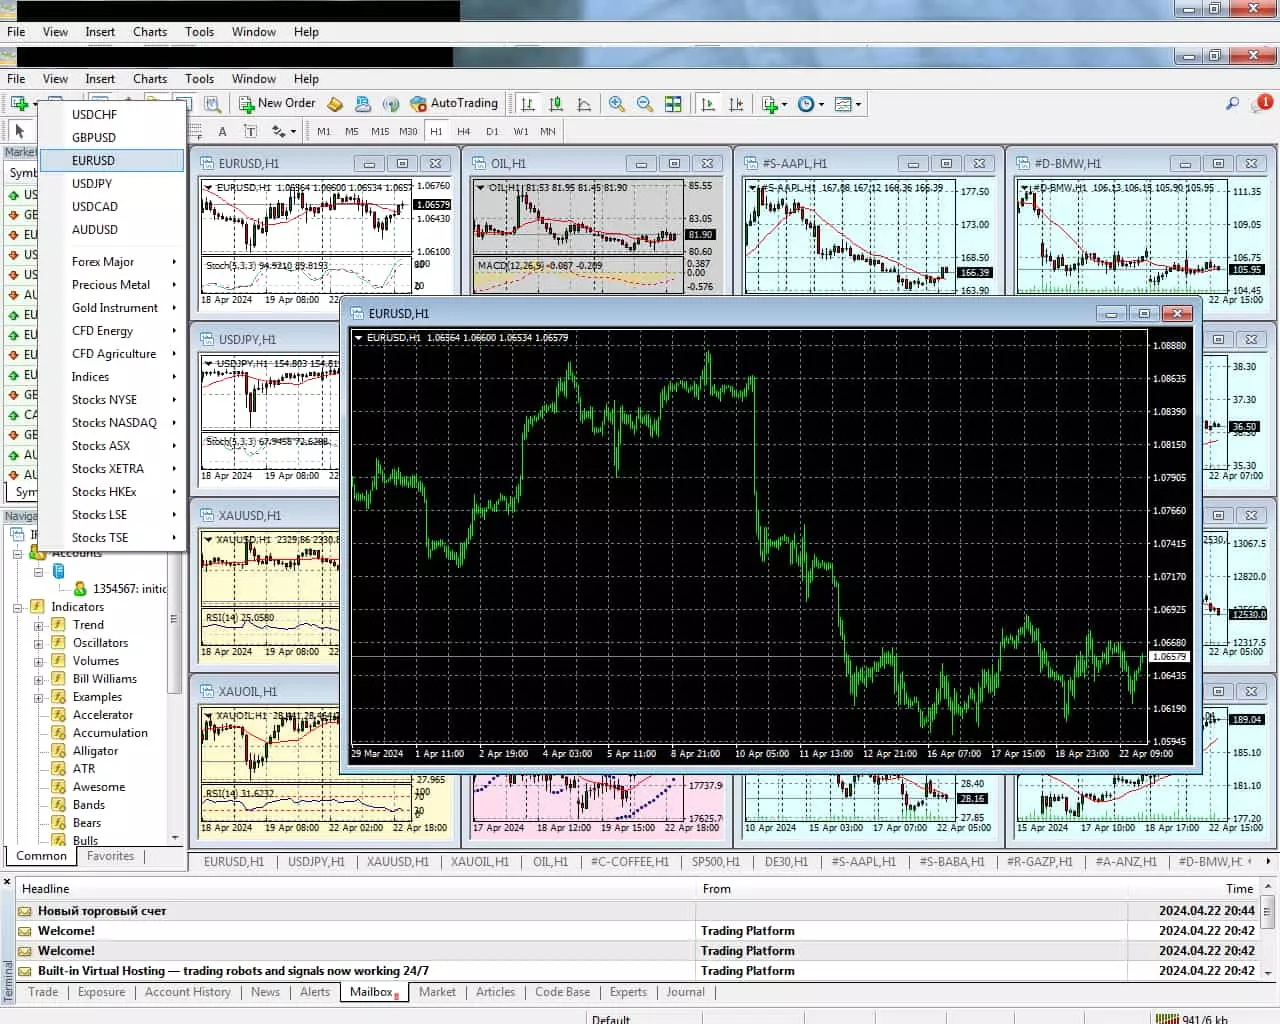
Step 1: Open a chart
Launch the MetaTrader 4 (MT4) platform;
Select "File" from the top menu, then "New Chart" to set up a currency pair or other financial instrument.
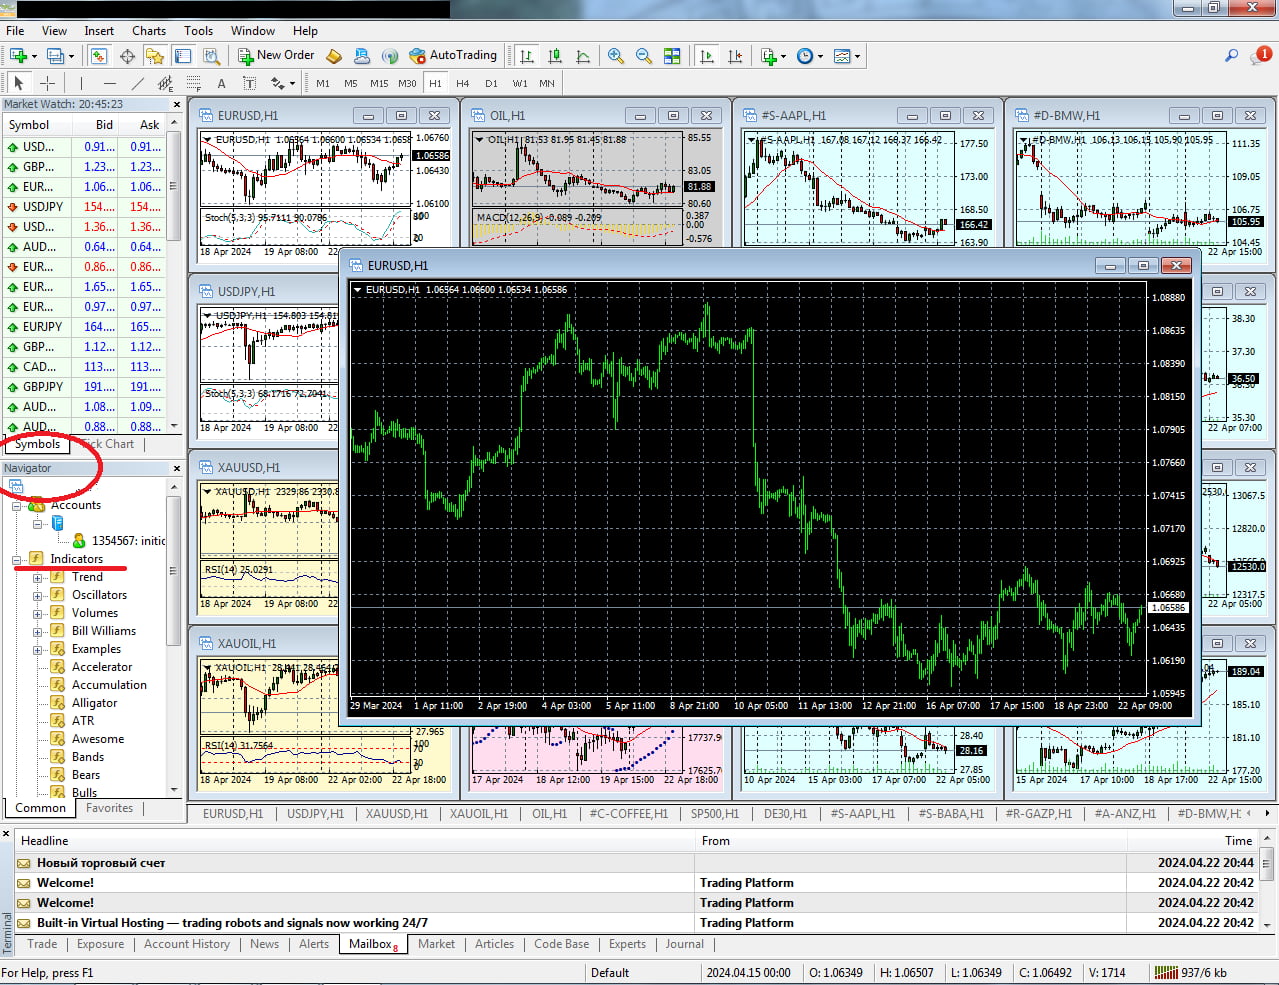
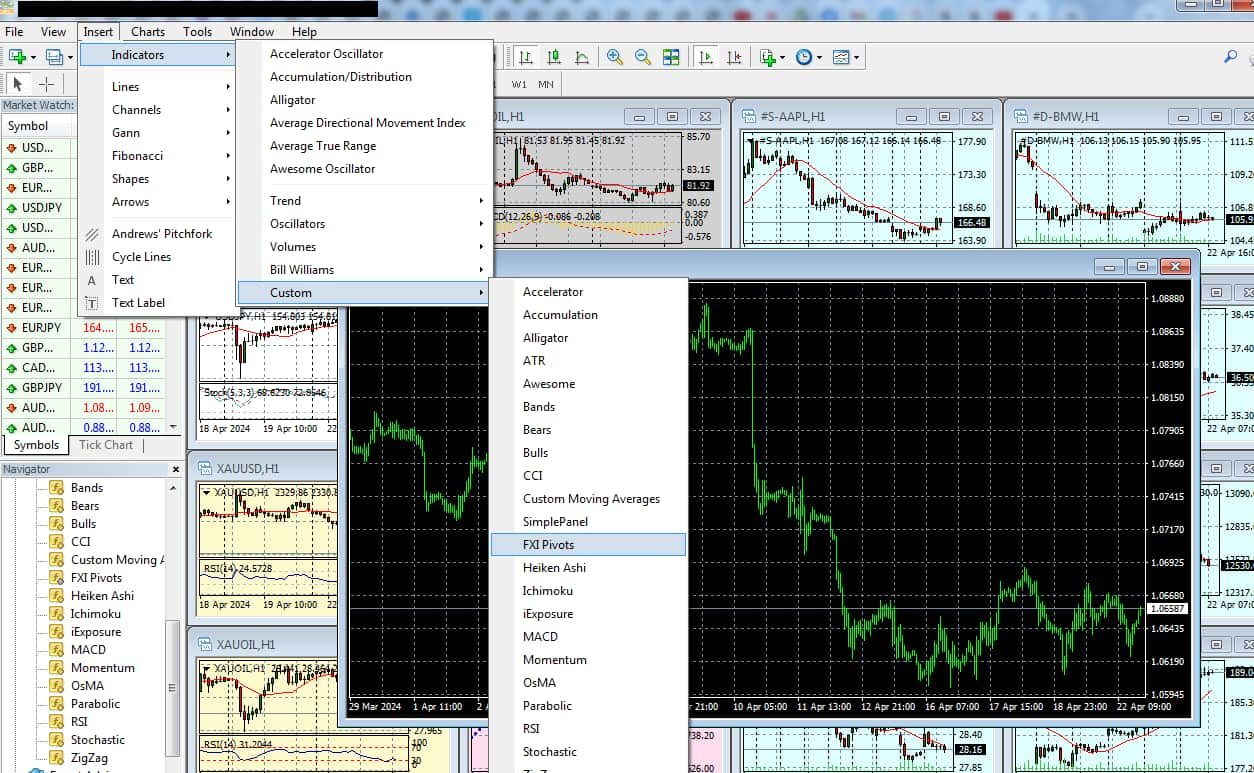
Step 2: Open the navigator window
Locate the "Navigator" window on the left side of the screen or open it by pressing the "Ctrl + N" key on your keyboard.
Navigate down the list until you reach the "Pivot Points" option;
Double left click on the "Pivot Points" or drag it to the chart.
Step 3: Customize the indicator
In the "Navigator" window, find the "Indicators" section and click on it to expand the list of indicators;
Navigate down the list until you reach the "Pivot Points" option;
Double left click on the "Pivot Points" or drag it to the chart.
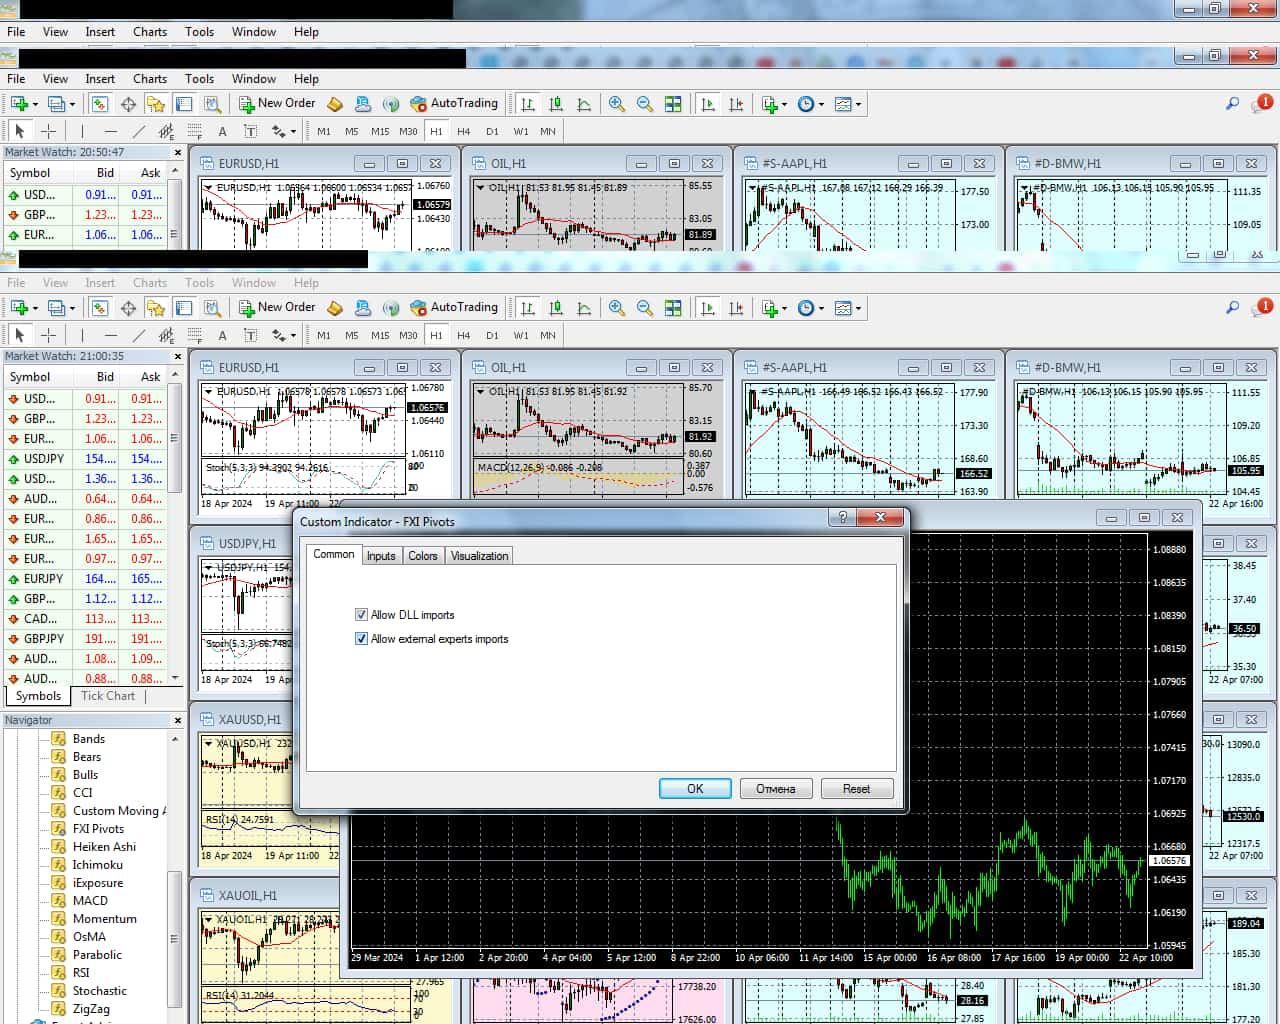
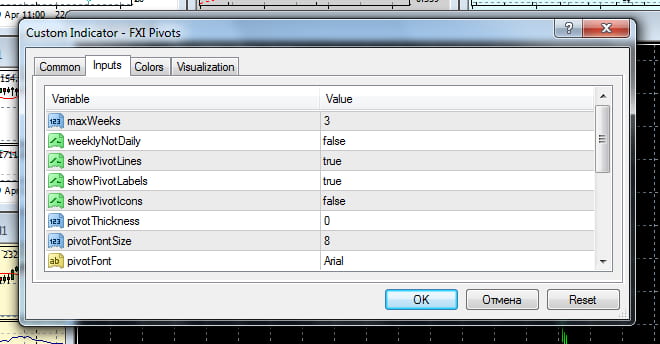
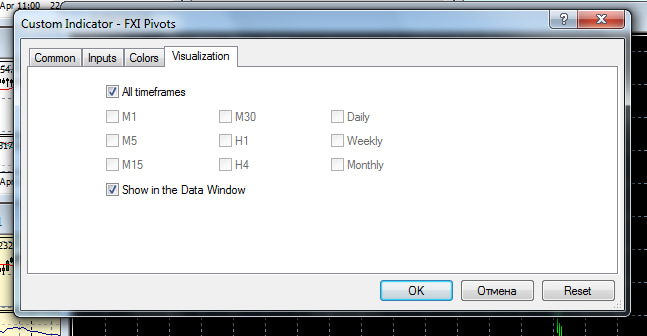
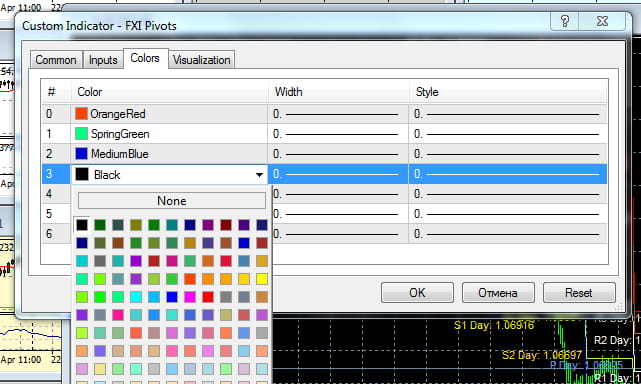
Step 4: Customizing parameters
After adding the indicator, a window with parameters will open. The trader can change parameter values such as period, colors and line style according to his preferences;
Once the parameter customization is complete, click "OK".
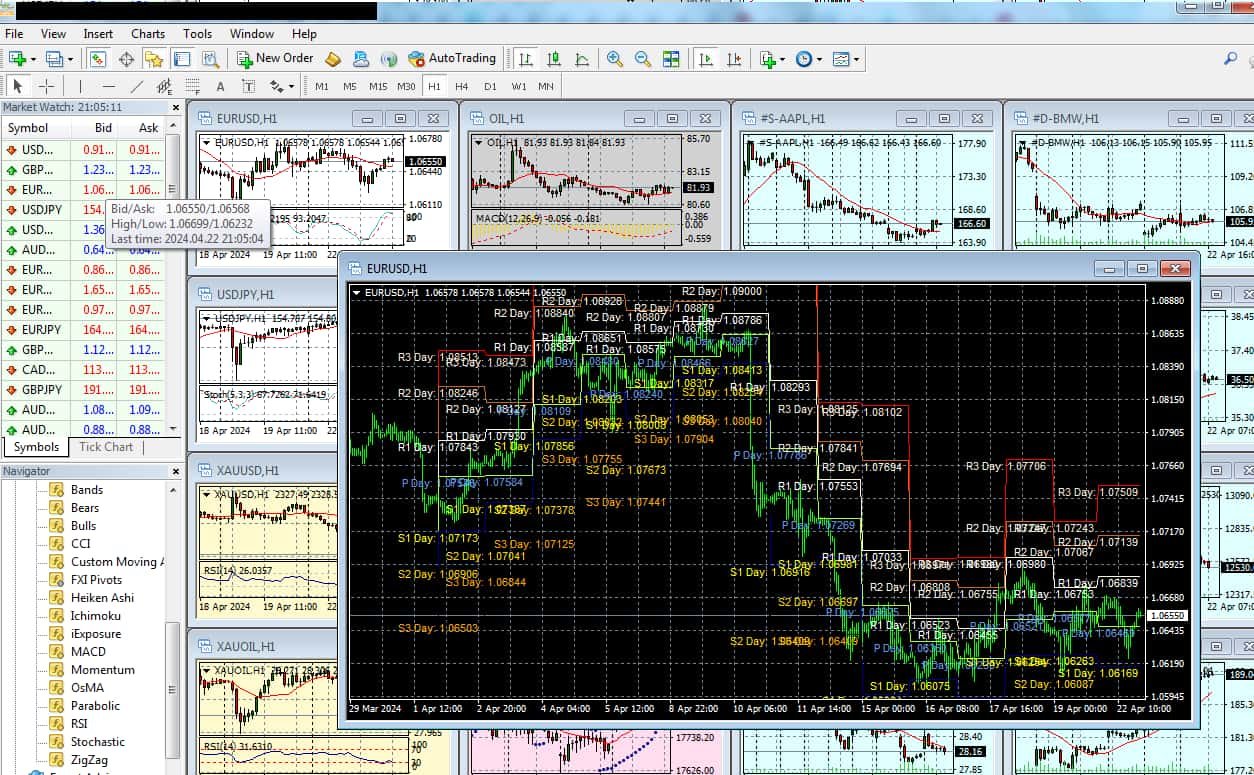
Step 5: View the results
The Pivot Points indicator will already be displayed on the chart. You can see the lines of support and resistance levels calculated based on the previous period;
Now you have the Pivot Points indicator on your MT4 chart, which will help you to identify key price levels and make the right trading decisions.
Why are pivot points so powerful?
Using pivot points for forex trading and beyond, a trader should understand why they are considered such powerful analytical tools. There are several reasons for this.
1. Easy to use
One of the main advantages of pivot points is their ease of use. Pivot point calculations are based on a standard formula that does not require complex mathematical calculations. Traders can easily apply pivot points to charts and trading strategies.
2. Universality
Pivot points can be calculated on a variety of timeframes, ranging from intraday to monthly. This renders them a versatile instrument suitable for traders at any skill level.
3. Historical significance
Pivot points have a long history of use in the market. Many traders and analysts attach great importance to them, as these points usually mark levels that in the past attracted the market's attention and influenced its historical changes.
4. Combination with other indicators
Pivot points are combined with other technical indicators such as moving averages or RSI. Market participants get more accurate trading alerts and increase the probability of successful trades.
5. Time constant
Pivot points are calculated based on previous price data, which makes them quite stable over time. Therefore, traders can use them as a reliable tool to analyze the market in various trading situations.
6. Widespread use
Pivot points are very commonly used in the trading and analytics community. This means that most market participants pay attention to support and resistance levels, which in turn increases the importance of pivot points and - most importantly - their influence on price movement.
7. Flexibility in trading
Pivot points can be successfully applied in a variety of market conditions, including trending, sideways and volatile markets. Their flexibility makes them a handy tool, allowing trading strategies to be adapted to many market scenarios.
8. Automation option
Pivot points are easily automated using trading robots (Expert Advisors) in MetaTrader 4 (MT4) or other trading platforms. Then traders automatically receive signals based on pivot point levels, increasing trading efficiency.
I treat pivot points not as signals but as probability zones

When I first started trading, pivot points seemed almost too simple to take seriously – just another set of levels everyone plotted on their charts. But the longer I traded, the more I realized something important: the market often respects the levels that everyone else is watching. Pivot points fall exactly into that category. They don’t predict direction, but they do highlight where the market is likely to pause, accelerate, or reverse. And in my own experience, that has often made the difference between a clean trade and a costly mistake.
Today, I treat pivot points not as signals but as probability zones. For example, when price approaches a pivot after a strong impulse and volume starts dropping, that’s a moment I pay attention to. I’m not entering just because the level is there – I’m watching how the market behaves around it. A reaction, a shift in momentum, or a confirmation from another tool is usually what makes the setup valid. Using pivot points this way keeps my decision-making structured and prevents me from acting emotionally.
My advice to traders is straightforward: don’t expect pivot points to do the hard work for you. Think of them as reference points that help you understand where the crowd may react. Respect these levels, but let the price action show its intentions before you commit to a trade. Over time, this mindset helps you trade with more clarity and less noise.
If you integrate pivot points as part of a broader framework – rather than relying on them mechanically – they become one of the most consistent tools for reading market structure. With enough practice, they start functioning almost like an additional layer of market intuition.
Conclusion
Pivot points are a proven tool for Forex traders seeking to identify reliable support and resistance levels and to anticipate market movements with greater accuracy. By integrating pivot points into your trading strategy, you can enhance your decision-making, such as entering buy trades when the price approaches a support pivot or setting sell targets at key resistance levels. For example, traders often use the central pivot as a gauge for market sentiment and adjust their positions accordingly. Ultimately, mastering pivot points allows you to trade with more confidence, turning market fluctuations into valuable opportunities.
FAQs
What are the main differences between the various types of pivot points used in Forex trading?
How can traders combine pivot points with other technical indicators for improved accuracy?
Why should traders use historical data to practice pivot point strategies before live trading?
What role do support and resistance identified by pivot points play in risk management?
Editors' Top Picks and Insights

Brent nears $100: Why oil prices are rising

Gram Wallet launch: Can Telegram bring crypto to the masses?

AI without limits: How dangerous are neural networks?

Worldcoin on Wall Street: From iris scans to ETF

Mark Cuban's wealth philosophy: Why stocks matter more than salary or crypto

Dangerous but indispensable: Why the crypto market needs bridges
Related Articles
Team that worked on the article
Oleg Tkachenko is an economic analyst and risk manager having more than 14 years of experience in working with systemically important banks, investment companies, and analytical platforms. He has been a Traders Union analyst since 2018.
Dr. BJ Johnson is a PhD in English Language and an editor with over 15 years of experience. He earned his degree in English Language in the U.S and the UK.
Chinmay Soni is a financial analyst with more than 5 years of experience in working with stocks, Forex, derivatives, and other assets. As a founder of a boutique research firm and an active researcher, he covers various industries and fields, providing insights backed by statistical data.
Forex leverage is a tool enabling traders to control larger positions with a relatively small amount of capital, amplifying potential profits and losses based on the chosen leverage ratio.
Bitcoin is a decentralized digital cryptocurrency that was created in 2009 by an anonymous individual or group using the pseudonym Satoshi Nakamoto. It operates on a technology called blockchain, which is a distributed ledger that records all transactions across a network of computers.
An investor is an individual, who invests money in an asset with the expectation that its value would appreciate in the future. The asset can be anything, including a bond, debenture, mutual fund, equity, gold, silver, exchange-traded funds (ETFs), and real-estate property.
Cryptocurrency is a type of digital or virtual currency that relies on cryptography for security. Unlike traditional currencies issued by governments (fiat currencies), cryptocurrencies operate on decentralized networks, typically based on blockchain technology.
CFD is a contract between an investor/trader and seller that demonstrates that the trader will need to pay the price difference between the current value of the asset and its value at the time of contract to the seller.

-
 Afghanistan
-
 Albania
-
 Algeria
-
 Angola
-
 Argentina
-
 Armenia
-
 Australia
-
 Austria
-
 Azerbaijan
-
 Bahamas
-
 Bahrain
-
 Bangladesh
-
 Belarus
-
 Belgium
-
 Bolivia
-
 Botswana
-
 Brazil
-
 Brunei
-
 Bulgaria
-
 Cambodia
-
 Cameroon
-
 Canada
-
 Chile
Chile
-
 China
China
-
 Colombia
-
 Congo
Congo
-
 Costa Rica
-
 Cote d'Ivoire
-
 Croatia
-
 Cuba
Cuba
-
 Cyprus
-
 Czechia
-
 DR Congo
-
 Denmark
-
 Dominican Republic
-
 Ecuador
-
 Egypt
Egypt
-
 El Salvador
-
 Estonia
-
 Eswatini
-
 Ethiopia
-
 Finland
-
 France
-
 Georgia
-
 Germany
-
 Ghana
Ghana
-
 Greece
-
 Haiti
Haiti
-
 Hong Kong
-
 Hungary
-
 India
India
-
 Indonesia
-
 Iran, Islamic republic
-
 Iraq
Iraq
-
 Ireland
-
 Israel
-
 Italy
Italy
-
 Jamaica
-
 Japan
Japan
-
 Jordan
-
 Kazakhstan
-
 Kenya
Kenya
-
 Korea
Korea
-
 Kuwait
-
 Kyrgyzstan
-
 Laos
Laos
-
 Latvia
-
 Lebanon
-
 Lesotho
-
 Libya
Libya
-
 Lithuania
-
 Luxembourg
-
 Madagascar
-
 Malaysia
-
 Malta
Malta
-
 Mauritius
-
 Mexico
-
 Moldova
-
 Mongolia
-
 Montenegro
-
 Morocco
-
 Mozambique
-
 Myanmar
-
 Namibia
-
 Nepal
Nepal
-
 Netherlands
-
 New Zealand
-
 Nigeria
-
 North Macedonia
-
 Norway
-
 Oman
Oman
-
 Pakistan
-
 Palestine
-
 Panama
-
 Papua New Guinea
-
 Paraguay
-
 Peru
Peru
-
 Philippines
-
 Poland
-
 Portugal
-
 Puerto Rico
-
 Qatar
Qatar
-
 Reunion
-
 Romania
-
 Rwanda
-
 Saudi Arabia
-
 Serbia
-
 Singapore
-
 Slovakia
-
 Slovenia
-
 Somalia
-
 South Africa
-
 Spain
Spain
-
 Sri Lanka
-
 Sweden
-
 Switzerland
-
 Syria
Syria
-
 Taiwan
-
 Tajikistan
-
 Tanzania
-
 Thailand
-
 Trinidad and Tobago
-
 Tunisia
-
 Turkey
-
 UAE
UAE
-
 Uganda
-
 Ukraine
-
 United Kingdom
-
United States
-
 Uruguay
-
 Uzbekistan
-
 Venezuela
-
 Vietnam
-
 Yemen
Yemen
-
 Zambia
-
 Zimbabwe
- Forex
- Crypto
