Best Fractal Binary Options Strategies


Editorial Note: While we adhere to strict Editorial Integrity, this post may contain references to products from our partners. Here's an explanation for How We Make Money. None of the data and information on this webpage constitutes investment advice according to our Disclaimer.
Top fractal binary options strategies:
Reversal entry strategy using fractal confirmation – identifies turning points where a new fractal signals the likely end of the current trend.
Fractal breakout trading strategy – enters trades when price breaks above or below a fractal, signaling momentum continuation.
Fractal with support and resistance zones – combines fractal signals with key levels to filter out weak setups and improve accuracy.
Double fractal formation for stronger entries – waits for two consecutive fractals in the same direction to confirm higher-probability trades.
Many traders underestimate fractals, dismissing them as simple patterns. In reality, fractals are not traditional indicators that issue signals but structural markers showing the framework of price action. Reading them across timeframes helps detect institutional traps or false breakouts. In binary options, where timing is critical, fractals highlight market imbalance and guide strategies that anticipate structure and wait for confirmation.
Risk warning: Binary options trading is highly risky and may result in a total loss of funds. These speculative instruments often lack strong regulation, with over 80% of traders losing their capital. Invest only what you can afford to lose and seek professional advice.
Introduction to fractals in binary options
Many traders hear the term “fractal binary options strategy” and assume it’s just another pattern system. In reality, fractals are visual blueprints of market structure. They map out where price hesitated and reversed, allowing traders to anticipate future turning points. This article dives deep into fractal strategy techniques and shows how to use fractals with momentum filters, support and resistance and multiple timeframes.
Fractals don’t predict. Instead, they expose imbalance, places where buyers or sellers lose control. When you combine them with the right context, fractals become powerful timing tools for binary options where precision matters.
What is a fractal indicator in trading?
Fractals in technical analysis are derived from the mathematical concept of self‑similarity. On price charts they appear as five‑bar reversal patterns. A bearish fractal has the highest high in the middle, flanked by two lower highs on either side. A bullish fractal has the lowest low in the middle, with two higher lows surrounding it These patterns highlight potential pivot points where the market may change direction.
Because a fractal pattern requires two additional bars after the extreme point to confirm, it is technically a lagging indicator. In practice this means fractals identify where reversals already started, not where they will occur. Traders therefore use fractals as structural markers rather than standalone entry signals.
Why traders use fractals in binary options
In binary options trading, every second counts. Traders need clear points for entry, especially when using short expiries such as five or fifteen minutes. Fractal binary option strategy setups provide simple visual clues by marking recent swing highs and lows. When combined with a trend filter or a momentum indicator, fractals help traders answer a crucial question: is this pullback a tradable reversal or just noise?
Other benefits of using fractals include:
Structure awareness. Fractals show how price organizes into waves. When you identify a series of bullish fractals in an uptrend, it reveals rising support levels. In a downtrend, a string of bearish fractals marks falling resistance.
Timing enhancements. Rather than guessing when a candle will reverse, traders can wait for a fractal to form at a well‑defined level. This reduces early entries and false alarms.
Clarity for beginners. Novice traders often overcomplicate charts with multiple oscillators. Fractals provide an easy‑to‑see marker that anchors your analysis around actual price swings.
How fractals reveal price structure and reversal points
To understand how to use fractal indicators in binary options, you need to see how fractals align with market rhythm. Fractals mark the highs and lows within each wave. When price is trending, these waves move in one direction with periodic pullbacks. Identifying fractals on different timeframes helps you map the hidden structure and avoid trading against the dominant flow.
For example, on the 1‑hour EUR/USD chart shown below, notice how each swing high is followed by a bearish fractal and each swing low by a bullish fractal. By connecting these fractals with trendlines you can visualize rising support in an uptrend or descending resistance in a downtrend. When a new fractal forms right at a major support or resistance zone, the probability of a reversal increases.
Fractals also expose liquidity traps. Large players often push prices beyond obvious highs or lows to trigger stop orders before reversing. Fractals flag these traps: a bearish fractal appearing slightly above a resistance line suggests a bull trap, while a bullish fractal slightly below support hints at a bear trap. Recognizing these patterns can help binary traders avoid chasing breakouts that soon reverse.
How the fractal indicator works
Most trading platforms, including TradingView and MetaTrader, offer the Bill Williams fractal indicator. The indicator scans for five‑bar sequences where the middle bar is an extreme high or low, then plots an arrow above or below the extreme bar once two subsequent candles form on the right. The indicator does not repaint; once a fractal is printed, it remains on the chart.
Because the indicator waits for confirmation, there is a slight delay. However, for binary options traders this delay isn’t problematic, binary trades typically last minutes, not ticks. The key is to use fractals as reference points for support, resistance and breakout levels rather than trying to trade every fractal as it appears.
Bullish and bearish fractal patterns explained
Fractal patterns can be used in a variety of ways. The simplest application is to treat each fractal as a potential support or resistance area:
Bullish fractal. The low candle is surrounded by two higher lows on either side. This pattern suggests sellers attempted to push prices lower but failed, implying buyers are now stepping in. Traders often draw a horizontal line at the middle bar’s low and watch for price to retest that level. If the level holds, a call (up) option becomes attractive.
Bearish fractal. The high candle is surrounded by two lower highs. This indicates buyers lacked strength to continue the rally. A put (down) option is considered if the price re‑tests the fractal high and fails to break above it.
While the basic pattern uses five bars, some traders modify the rules to require six or seven bars for extra confirmation. Others integrate volume or candle body size filters. The concept remains the same: identify local extremes to anchor your trading decisions.
Timeframe selection and fractal visibility
One mistake new traders make is using fractals on very low timeframes without a filter. On one‑minute charts, fractals form frequently and many are meaningless. Higher timeframes such as 5‑minute, 15‑minute or 1‑hour charts generate fewer fractals but offer more reliable levels. Binary options traders often use a higher timeframe (e.g., 15‑minute) to set context and a lower timeframe (e.g., 1‑minute) to fine‑tune entries. The principle of multi‑timeframe analysis, aligning fractals across two or more timeframes, helps ensure your trade goes with the prevailing structure.
Difference between fractals and other reversal tools
Fractals differ from oscillators like RSI or stochastic because they derive solely from price patterns. Oscillators calculate momentum based on closing prices and can be lagging; fractals mark actual swing highs and lows. Moving averages smooth price and are best used for trend identification, but they do not show where reversals occur. So, traders using the Fractal binary options strategy use fractals as signposts and rely on oscillators or moving averages as filters.
Another difference is psychological. Fractals reflect how groups of traders react at key levels. A fractal is created because traders collectively stall and reverse. This human element makes fractals useful for understanding market sentiment, whereas purely mathematical indicators may miss these nuances.
Top fractal binary options strategies
The fractal indicator offers several practical ways to build reliable trading setups. In the fast-paced world of binary options, where precise timing is key, fractals can help traders identify reversal zones, breakouts, and key support-resistance confluences. Below are four effective strategies that traders often rely on when working with fractals in the binary options market.
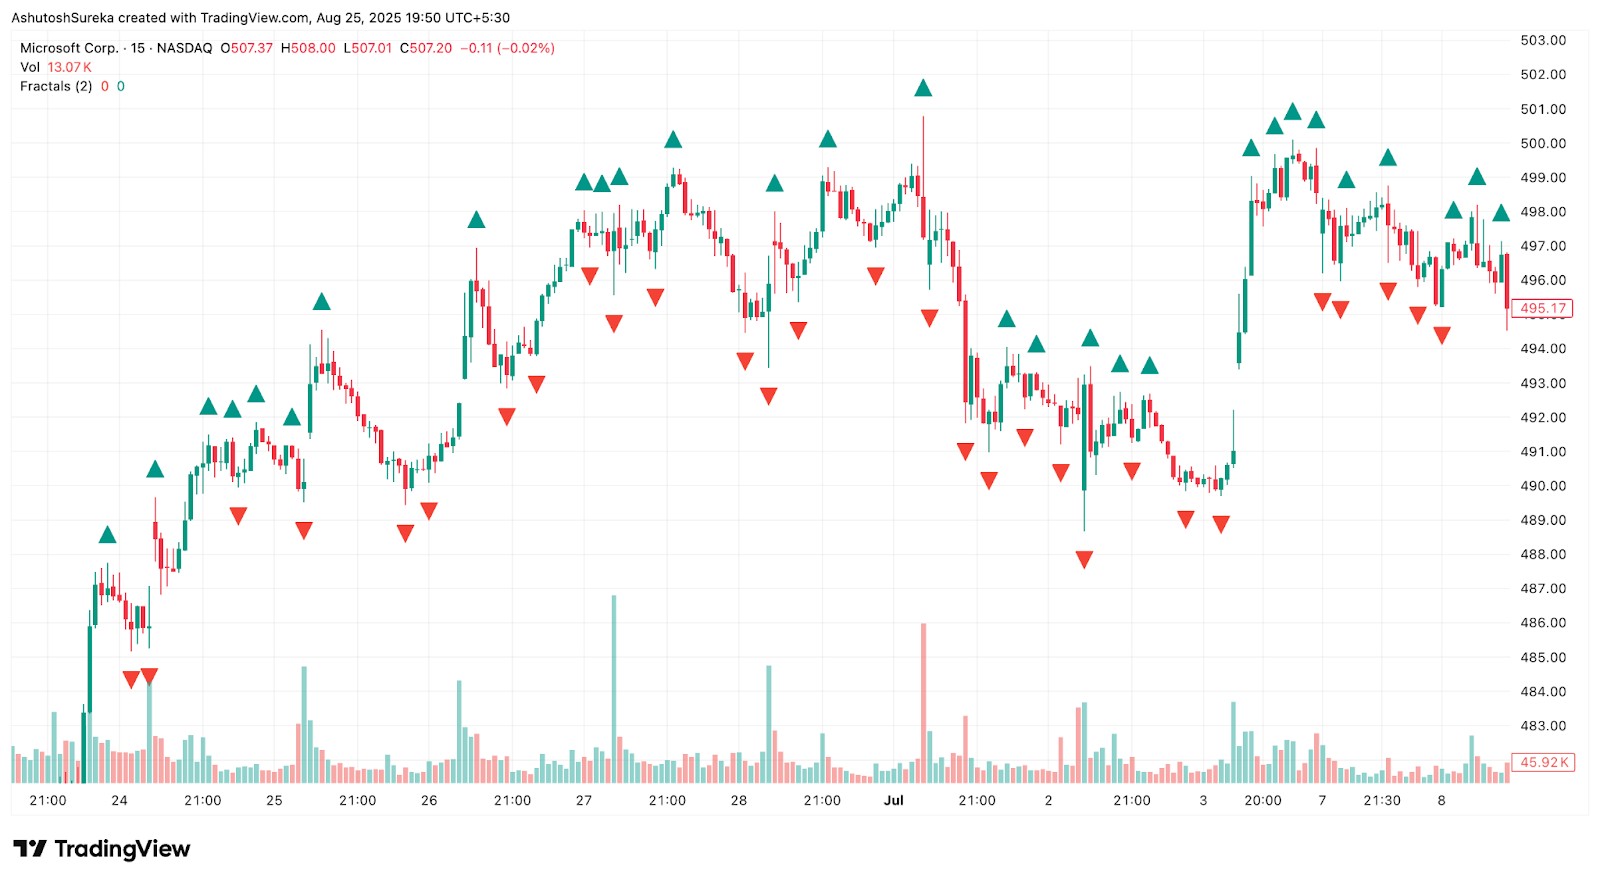
Reversal entry strategy using fractal confirmation
Fractals are highly effective in pinpointing moments when the market is rejecting certain price levels. This makes them ideal tools for traders looking to catch reversals. In a typical fractal binary options strategy, a single bullish or bearish fractal can serve as a clear early signal that market momentum is shifting direction.

How to apply it:
Wait for a bullish fractal to appear near a recent swing low as a sign of potential upward reversal.
Watch for a bearish fractal forming around a swing high to signal possible downside movement.
Only enter the trade once a confirmation candle closes past the fractal level.
Try combining fractal signals with price action clues such as long wicks or doji candles. Avoid entries when fractals appear inside choppy or sideways ranges, as signals may be less reliable.
Fractal breakout trading strategy
Breakout trades are tricky because false signals are common, but fractals offer a solution by marking recent highs and lows, helping define clear breakout levels. This method allows traders to prepare in advance and respond decisively when price breaks through key points.
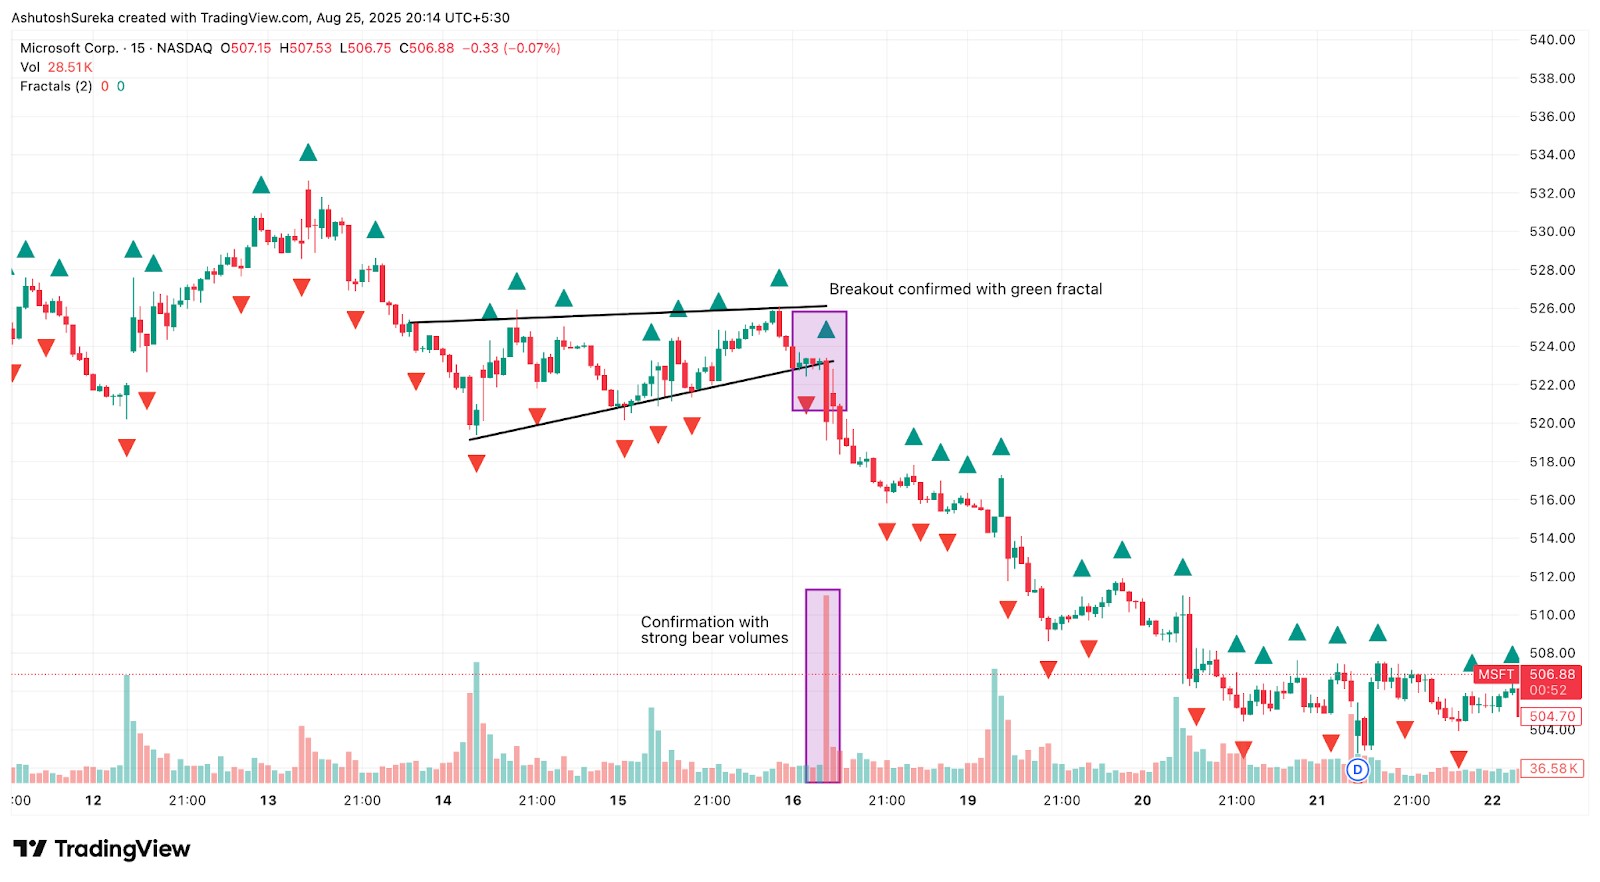
How to apply it:
Use horizontal lines to mark the latest bullish and bearish fractal levels.
If price breaks above the most recent bearish fractal high, consider entering a call position.
If price drops below the last bullish fractal low, look for a put trade setup.
Always wait for one full candle to close beyond the fractal before taking action. This method works best during volatile trading periods when breakouts tend to follow through.
Fractal with support and resistance zones
Support and resistance zones naturally align with fractals since both highlight areas where price tends to reverse or hesitate. Combining them strengthens your entries and gives added confirmation, making this a preferred setup for those using a fractal binary option strategy.

How to apply it:
First, mark out important support and resistance levels using higher timeframes.
Watch for fractal patterns forming exactly on those levels.
When price reacts with a strong fractal rejection at these zones, consider entering.
The more often a support or resistance level has been tested, the more reliable it becomes. Don’t rely on fractals alone, watch how candles behave near the zone before making a move.
Double fractal formation for stronger entries
A double fractal occurs when two or more fractals form close to the same price point. This double signal suggests stronger conviction and often shows up near major turning points in the market.
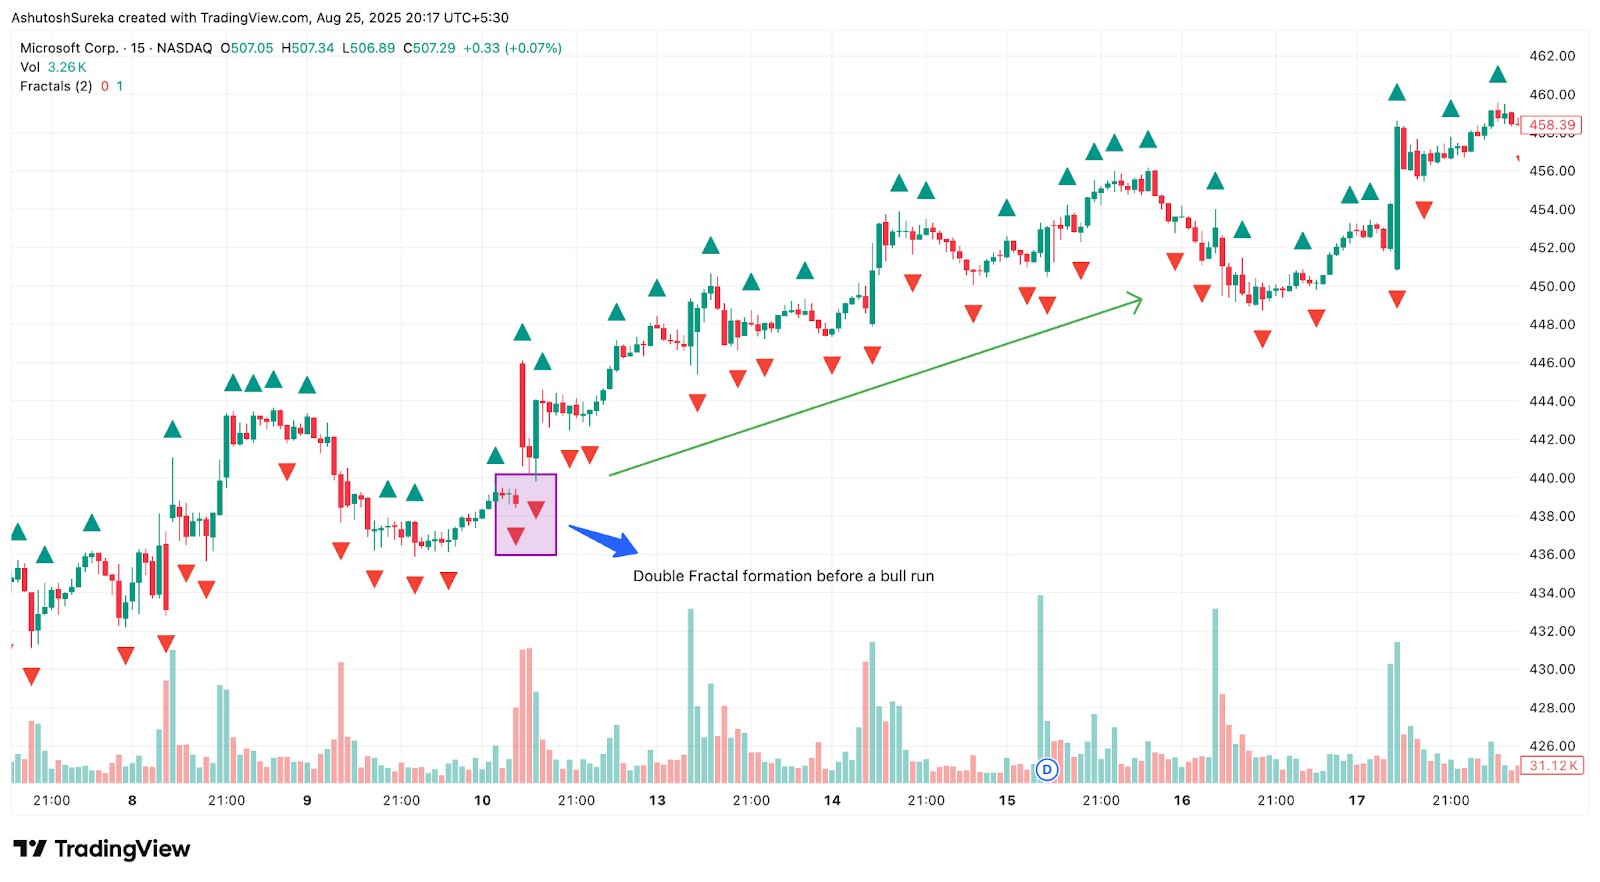
How to apply it:
Look for two consecutive bullish fractals forming close to a support zone as this strengthens a long setup.
Similarly, two bearish fractals appearing near resistance may indicate a strong sell signal.
Confirm the direction by waiting for the next candle to support the expected move.
Double fractals are less frequent but provide higher-quality signals. They tend to perform better on 15-minute or higher timeframes, where noise is reduced and structure is clearer.
Combining fractals with technical indicators
While fractals alone can be powerful, many traders improve their accuracy by combining them with other technical tools. In binary options trading, fractals can act as the signal while indicators such as RSI, moving averages, or ATR confirm momentum, direction, or volatility. This blend helps reduce false setups and gives traders more confidence.
Fractal with RSI or stochastic for momentum signals
Momentum indicators like RSI or stochastic work well with fractals because they reveal whether the market is overbought or oversold. A fractal marks a turning point, and the momentum indicator shows whether that turning point has the strength to follow through.
How to apply it:
A bullish fractal at support is stronger when RSI is below 30 or stochastic shows oversold conditions.
A bearish fractal at resistance is more reliable when RSI is above 70 or stochastic signals overbought.
Enter after the candle closes to confirm both the fractal and momentum alignment.
Fractal and moving average crossover confirmation
Moving averages filter noise and show overall trend direction. When combined with fractals, they help traders trade in line with the trend rather than against it.
How to apply it:
Use a short-term and long-term moving average, such as 10 EMA and 30 EMA.
A bullish fractal becomes a higher probability trade when the fast MA crosses above the slow MA.
A bearish fractal has more weight when the fast MA is below the slow MA.
This ensures that fractal signals are traded in harmony with the bigger trend.
Fractal with ATR to gauge volatility
ATR (Average True Range) measures volatility and can help traders decide whether a fractal signal is worth taking. A fractal at support or resistance has greater validity when ATR is high, meaning the market has enough energy to sustain the move.
How to apply it:
Look for bullish fractals when ATR readings are above average, confirming volatility supports the move.
Avoid fractal signals during very low ATR, as the market may not move enough to make the trade profitable.
Combine ATR with fractals for breakout trades, where strong volatility is required for follow-through.
Strengths and limitations of fractal strategies
Fractals are widely used in binary options trading because they provide simple visual markers of turning points. However, like any method, a fractal-based approach has both strengths and weaknesses. Understanding these can help traders apply fractals more effectively and avoid relying on them blindly.
Benefits of using fractals for timing reversals
One of the key advantages of using fractals is their ability to clearly mark natural support and resistance zones. Since they appear at swing highs and lows, they offer useful clues about momentum shifts and possible reversal points. This is a core component of any well-structured fractal binary options strategy, especially for traders focusing on short-term expiry setups.
Benefits of fractals in binary options:
Easy to grasp and beginner-friendly.
Help identify entry and exit points without complex calculations.
Can be combined with other tools like momentum or trend indicators.
Because of these qualities, fractals work well for traders who prefer a structured and rule-based way of identifying market reversals.
Common mistakes and overfitting risks
While fractals offer helpful insights, many traders misuse them by assuming every signal leads to a reversal. In reality, they appear often, and not all carry the same weight:
Overfitting happens when a strategy is overly tailored to past fractal signals that may not repeat.
Blindly following every fractal can lead to losses, especially in sideways or volatile markets.
Ignoring broader context, such as the overall trend, can turn a useful fractal into a false signal.
Those using a fractal binary option strategy should treat fractals as a guide and not a guaranteed prediction. Understanding when to trust a signal and when to skip it is what separates effective traders from those who chase every setup.
Avoiding false signals with filter conditions
The best binary options fractal strategy uses filters to increase signal quality. Some practical tips:
Trade with the trend. Use moving averages or trendlines to determine the dominant direction. Only take bullish fractals in an uptrend and bearish fractals in a downtrend.
Wait for confirmation. Let price close beyond the fractal level. Many false breaks occur when traders enter at the fractal itself rather than after confirmation.
Align with key levels. Place trades only when fractals coincide with major support or resistance. Random fractals in the middle of a range are less meaningful.
Combine indicators. Confirm fractal signals with RSI, stochastic, ATR or volume. A confluence of signals reduces noise.
Once you have a clear strategy in place, the next step is choosing the right broker that supports reliable execution. Below is a comparison table of top binary options brokers to help you apply these filters effectively in live trading.
| Foundation year | Min. deposit | Min. trade size | Min. Payout (%) | Max. Payout (%) | Demo | Copy trading | Open an account | |
|---|---|---|---|---|---|---|---|---|
| 2013 | 5 | 1 | 17 | 95 | Yes | No | Go to broker Your capital is at risk. |
|
| 2019 | 10 | 1 | 60 | 90 | Yes | No | Go to broker Your capital is at risk.
|
|
| 2009 | 250 | 1 | No | 100 | Yes | No | Study review | |
| 2017 | 5 | 1 | 50 | 128 | Yes | Yes | Go to broker Your capital is at risk. |
|
| 2019 | 10 | 1 | 20 | 98 | Yes | No | Go to broker Your capital is at risk. |
Refining binary entries with multi-fractal clusters and fakeout traps

Most beginners use fractals as static reversal signals, but you’ll unlock real power when you stop viewing them as isolated events. Instead, track multi-fractal clusters across timeframes. When fractals appear repeatedly near a structural support/resistance level across the 1-minute, 5-minute, and 15-minute charts, it’s a high-probability zone, not just because of the pattern, but due to market memory and crowd reaction clustering. This stacking of fractal signals acts like confluence layers and adds strong context to otherwise noisy price action. You’re not just seeing where price reversed, you’re seeing why it consistently reacts there.
Here’s a twist that sets advanced users apart: learn to recognize fakeout fractals. These occur when a candle breaks past a previous fractal high/low just to reverse violently. Combine this with momentum divergence (e.g., RSI or MACD cross-checks) and liquidity zones to trade against the herd. When everyone jumps in on a breakout fractal, but the oscillator shows weakening momentum and you spot a liquidity sweep wick, that’s your trap entry. These setups are less frequent, but carry outsized returns if you're patient and know what you're looking for.
Conclusion
Fractals are not magic. They are more like zooming in to see where price holds its breath. If you use them like a regular pattern you are missing the point. But when you slow down add them to clear zones and trust them for timing they stop being shapes and start helping you make smarter calls. In binary options that change matters most.
FAQs
What assets respond best to fractal strategies?
Fractal strategies work well on trending assets like major forex pairs, indices, and liquid stocks, where price structure is clearer. They are less effective in choppy or low-volume markets.
How do I filter out noise when using fractals?
To reduce noise, use higher timeframes like 15-minute or above and combine fractals with support and resistance zones or price action filters. Avoid trading every fractal and focus on those aligned with market direction.
Can I automate a fractal binary options strategy?
Yes, fractal strategies can be automated using custom scripts or trading bots that recognize pattern logic. However, proper backtesting and risk controls are essential to handle false signals and market variability.
What’s the difference between Bill Williams fractals and custom fractals?
Bill Williams fractals follow a strict five-candle pattern, while custom fractals may adjust the number of bars or add filters like volume or candle size. Custom versions offer more flexibility but may vary in reliability.
Editors' Top Picks and Insights

AI without limits: How dangerous are neural networks?

Worldcoin on Wall Street: From iris scans to ETF

Mark Cuban's wealth philosophy: Why stocks matter more than salary or crypto

Dangerous but indispensable: Why the crypto market needs bridges

Markus Levin: DePIN could power the AI agent economy

Pokémon cards for $2,500: How collectibles became a new form of gambling
Related Articles
Team that worked on the article
Ciaran Ryan is a veteran financial journalist based in South Africa, where he covers cryptocurrency, mining, stock markets, and governance for Moneyweb. He also hosts the weekly Moneyweb Crypto Podcast.
Dan Blystone began his trading career in 1998 as an arbitrage clerk on the floor of the Chicago Mercantile Exchange (CME). He later traded bond and Eurex futures at proprietary firms such as Altea Trading, gaining valuable experience in high-frequency trading and risk management.
Chinmay Soni is a financial analyst with more than 5 years of experience in working with stocks, Forex, derivatives, and other assets. As a founder of a boutique research firm and an active researcher, he covers various industries and fields, providing insights backed by statistical data.
Risk management is a risk management model that involves controlling potential losses while maximizing profits. The main risk management tools are stop loss, take profit, calculation of position volume taking into account leverage and pip value.
Xetra is a German Stock Exchange trading system that the Frankfurt Stock Exchange operates. Deutsche Börse is the parent company of the Frankfurt Stock Exchange.
The Stochastic Oscillator is a technical indicator used in financial analysis to gauge the momentum of a security's price and identify overbought or oversold conditions by comparing the closing price to a specified price range over a defined period.
Bitcoin is a decentralized digital cryptocurrency that was created in 2009 by an anonymous individual or group using the pseudonym Satoshi Nakamoto. It operates on a technology called blockchain, which is a distributed ledger that records all transactions across a network of computers.
Options trading is a financial derivative strategy that involves the buying and selling of options contracts, which give traders the right (but not the obligation) to buy or sell an underlying asset at a specified price, known as the strike price, before or on a predetermined expiration date. There are two main types of options: call options, which allow the holder to buy the underlying asset, and put options, which allow the holder to sell the underlying asset.

-
 Afghanistan
-
 Albania
-
 Algeria
-
 Angola
-
 Argentina
-
 Armenia
-
 Australia
-
 Austria
-
 Azerbaijan
-
 Bahamas
-
 Bahrain
-
 Bangladesh
-
 Belarus
-
 Belgium
-
 Bolivia
-
 Botswana
-
 Brazil
-
 Brunei
-
 Bulgaria
-
 Cambodia
-
 Cameroon
-
 Canada
-
 Chile
Chile
-
 China
China
-
 Colombia
-
 Congo
Congo
-
 Costa Rica
-
 Cote d'Ivoire
-
 Croatia
-
 Cuba
Cuba
-
 Cyprus
-
 Czechia
-
 DR Congo
-
 Denmark
-
 Dominican Republic
-
 Ecuador
-
 Egypt
Egypt
-
 El Salvador
-
 Estonia
-
 Eswatini
-
 Ethiopia
-
 Finland
-
 France
-
 Georgia
-
 Germany
-
 Ghana
Ghana
-
 Greece
-
 Haiti
Haiti
-
 Hong Kong
-
 Hungary
-
 India
India
-
 Indonesia
-
 Iran, Islamic republic
-
 Iraq
Iraq
-
 Ireland
-
 Israel
-
 Italy
Italy
-
 Jamaica
-
 Japan
Japan
-
 Jordan
-
 Kazakhstan
-
 Kenya
Kenya
-
 Korea
Korea
-
 Kuwait
-
 Kyrgyzstan
-
 Laos
Laos
-
 Latvia
-
 Lebanon
-
 Lesotho
-
 Libya
Libya
-
 Lithuania
-
 Luxembourg
-
 Madagascar
-
 Malaysia
-
 Malta
Malta
-
 Mauritius
-
 Mexico
-
 Moldova
-
 Mongolia
-
 Montenegro
-
 Morocco
-
 Mozambique
-
 Myanmar
-
 Namibia
-
 Nepal
Nepal
-
 Netherlands
-
 New Zealand
-
 Nigeria
-
 North Macedonia
-
 Norway
-
 Oman
Oman
-
 Pakistan
-
 Palestine
-
 Panama
-
 Papua New Guinea
-
 Paraguay
-
 Peru
Peru
-
 Philippines
-
 Poland
-
 Portugal
-
 Puerto Rico
-
 Qatar
Qatar
-
 Reunion
-
 Romania
-
 Rwanda
-
 Saudi Arabia
-
 Serbia
-
 Singapore
-
 Slovakia
-
 Slovenia
-
 Somalia
-
 South Africa
-
 Spain
Spain
-
 Sri Lanka
-
 Sweden
-
 Switzerland
-
 Syria
Syria
-
 Taiwan
-
 Tajikistan
-
 Tanzania
-
 Thailand
-
 Trinidad and Tobago
-
 Tunisia
-
 Turkey
-
 UAE
UAE
-
 Uganda
-
 Ukraine
-
 United Kingdom
-
United States
-
 Uruguay
-
 Uzbekistan
-
 Venezuela
-
 Vietnam
-
 Yemen
Yemen
-
 Zambia
-
 Zimbabwe
- Forex
- Crypto
