What Is Index Trading? Strategies, Pros And Cons
Index trading offers access to a broad market segment with potential for diversification and liquidity. Profitability hinges on strategic planning, market analysis, and risk control. Beginners should focus on education, selecting the right broker, and crafting a well-defined trading plan to navigate the indices landscape.
Index trading is a unique domain where understanding and strategy converge to create opportunities. Our focus is to demystify index trading, making it accessible and comprehensible for beginners. This guide serves as your entry point into the world of indices, illuminating the path toward informed trading decisions.
-
Is trading index profitable?
Index trading can be profitable, especially for informed traders who apply effective strategies and risk management techniques, but like all forms of trading, it carries the risk of losses.
-
Which index is better for trading?
The best index for trading depends on the trader's goals, risk tolerance, and market knowledge; popular choices include the S&P 500 for its liquidity and the NASDAQ for technology exposure.
-
What is the best strategy for trading indices?
The best strategy for trading indices varies by individual, but it often involves a combination of technical and fundamental analysis tailored to the trader's time frame and risk profile.
-
How to start trading indices?
To start trading indices, educate yourself on the basics, choose a reputable broker, open and fund your account, develop a trading strategy, and diligently apply risk management. Specific descriptions of each step are contained in the guide: How To Start Trading On The Stock Market
What is index trading?
Indexes, or indices, are indicators or statistical measures that represent the performance of a basket of assets. These assets could be stocks, bonds, or commodities. An index reflects the collective health and trends of the selected assets, providing a snapshot of a particular market segment or the entire market.
Trading indices offers several compelling reasons for investors. First, it allows exposure to a broad market segment, diversifying risk across multiple assets. Secondly, it's a barometer of overall market sentiment, providing valuable insights into economic trends. Additionally, indices trading can be more cost-effective and less time-consuming compared to individual stock investments, making it a favored choice for many traders.
Types of index trading
Index trading types can be determined by different criteria.
By style:
-
Active Short-Term Trading
-
Intraday Trading: This style involves buying and selling indices within the same trading day. Traders capitalize on small price movements during the day, often requiring constant monitoring of the market
-
Scalping: Scalping is an even more rapid strategy, where traders aim for small profits from minor price changes. It's a high-volume, fast-paced technique that demands quick decision-making and execution
-
-
Passive Long-Term Investing
-
This approach is for those aiming to invest over a longer period. It involves holding index-based assets to benefit from overall market growth over time. It's less about daily market fluctuations and more about the long-term trend and compound interest
-
By underlying asset:
-
Stocks: Stock indices, like the S&P 500 or the Dow Jones, are the most popular. They represent a section of the stock market and are used as benchmarks for portfolio performance
-
Bonds: Bond indices give an insight into the fixed-income sector, tracking the performance of government or corporate debt securities
-
Commodities: These indices track the price movements of a basket of commodities, providing exposure to sectors like energy, metals, and agriculture
Instruments for trading indices
There are various financial instruments that can be used for trading Indices, and they are:
-
Futures: Futures contracts allow traders to speculate on the future price of an index. They're standardized and traded on exchanges, offering leverage and the ability to hedge against market downturns
-
Options: Options give traders the right, but not the obligation, to buy or sell an index at a predetermined price before a certain time. They're used for speculation or hedging
-
-
Cash CFD: Traders can speculate on the price movement of an index without actually owning the underlying asset. It's more flexible and usually has lower entry barriers
-
Futures CFD: Similar to cash CFDs, they mimic the dynamics of futures contracts, including expiry dates and settlement rules
-
-
ETF (Exchange-Traded Fund): ETFs are funds that track an index, commodity, bonds, or basket of assets like an index fund. They're traded like stocks, offering a practical way to invest in indices with diversification benefits
Each of these assets offers distinct advantages and suits different trading styles and objectives.
Best stock brokers 2024


An example of index trading
Let us assume that a trader is monitoring the S&P 500 index, seeking to capitalize on intraday movements. The trader identifies a potential shorting opportunity and decides to execute a trade based on the technical analysis of the chart pattern.

Example of a trade in the stock index market
Looking at the chart provided, we notice a significant candlestick that peaks just before a downtrend, signaling a potential sell point. The trader initiates a sell order at the top of this peak, marked by the red "Sell" label on the chart, which indicates a price of 4779.50.
As the market progresses, it becomes evident that the decision to sell was timely, as the index begins to drop. The trader then closes the position at the point marked "Close" on the chart, which is for 4765.00.
Such trades require precision and a firm grasp of technical analysis to identify the right entry and exit points. The example demonstrates how a well-timed trade in index trading can lead to substantial profits, even within a short period. However, it's essential to note that this also involves a significant risk, as movements in the opposite direction could lead to losses.
How profitable is trading indices?
To calculate the profit from this trade, we use the following formula:
Profit = (Sell Price − Close Price) × Ticks × Dollar Value per Tick
Assuming that one tick in the S&P 500 index is equivalent to a 0.25 price movement and the dollar value per tick is $12.50, the calculation for this trade would be:
Profit = (4779.50 − 4765.00) × 4 × $12.50 = $725.00
This means that for every 0.25 price movement, the trader makes or loses (in this particular case he makes) $12.50. In this example, the trader made a profit of $725.00 from this trade.
The calculations may be different if you consider more affordable CFDs on stock indices, in which case the risks, returns, and margin requirements will be much lower. Please refer to your broker's specific asset specifications for the most up-to-date information.
👍 Pros of trading indices
• Potential profits: Indices often encapsulate the growth and productivity of an economy or sector, offering the potential for substantial profits as markets expand
• Liquidity: Index markets are typically very liquid, meaning large volumes can be bought or sold without significantly affecting the market price, facilitating smoother entry and exit
• Abundance of fundamentals: Indices are influenced by a wide array of economic indicators, providing traders with numerous data points for informed decision-making
• Low fees: Compared to trading individual stocks, indices generally have lower commission fees and management costs, which is financially advantageous for traders
• Hedging and diversification: Trading indices allow investors to spread their risk across various sectors and use hedging strategies to mitigate potential losses, promoting a more stable investment environment
👎 Cons of trading indices
• Market risks: Indices are susceptible to market-wide risks; economic downturns can affect the entire index, potentially leading to significant losses
• Volatility: While providing profit opportunities, the inherent volatility of indices can lead to rapid and unpredictable market movements, posing a challenge for risk management
• Complexity: Understanding index movements requires knowledge of various market sectors and economic factors, which can be daunting for less experienced traders
• Super competitive: Index trading is a popular field, attracting many traders. This competition can make it challenging to achieve consistent success, especially for newcomers without sophisticated strategies or tools
Strategies for trading indices
When approaching index trading, diversity in strategy is key to navigating the ever-changing market conditions. Traders employ various methods, each with unique principles and objectives. However, 2 of the predominant strategies to use are:
-
Fundamental analysis: This strategy involves evaluating economic indicators, market sentiment, and financial performance to forecast index movements
-
Technical analysis: Traders using this approach analyze statistical trends gathered from trading activity, such as price movement and volume, to identify patterns that can suggest future activity
Trading indices using fundamental analysis
Fundamental analysis in index trading involves scrutinizing economic indicators, industry data, and other macroeconomic factors to determine the intrinsic value of the index. A classic example of this is comparing inflation rates with the performance of the S&P 500 index.
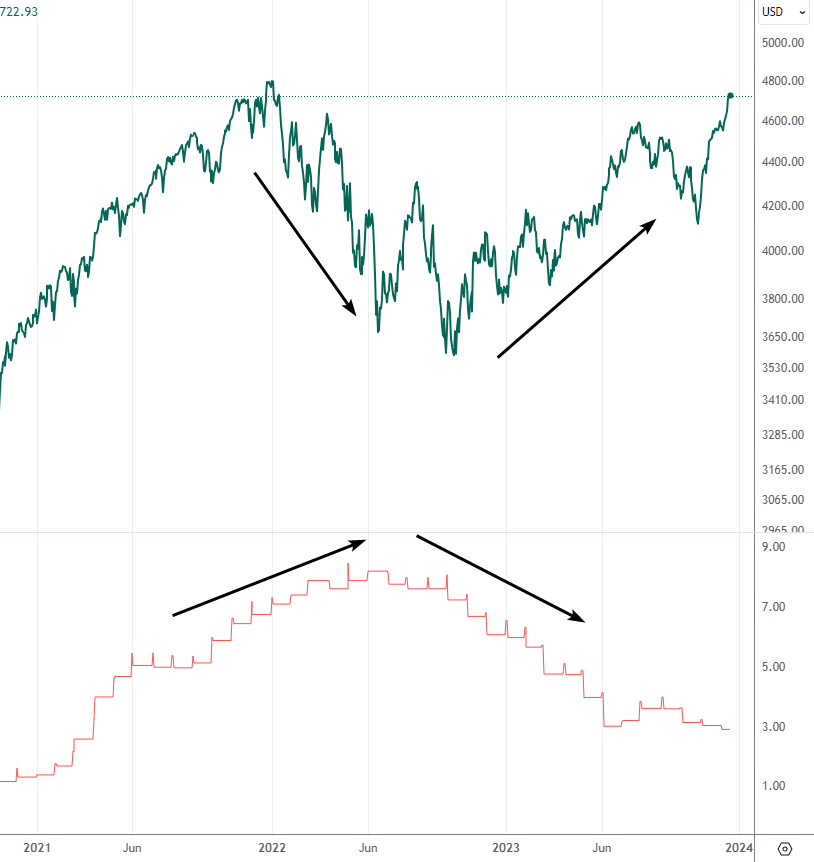
Fundamental approach for trading indices
The provided chart showcases two lines: one representing the S&P 500 index and the other tracking inflation over time. A noticeable trend can be observed where the S&P 500 index appears to move inversely to inflation rates.
When inflation trends upward, the index takes a downturn, as indicated by the arrows pointing in opposite directions. This inverse relationship can be attributed to the decrease in purchasing power and the potential tightening of monetary policy, which often leads to reduced corporate profits and investor sentiment.
Analyzing such correlations allows traders to make educated predictions about the potential movement of indices in response to changes in inflation. This information can be pivotal for making strategic trading decisions, particularly for long-term investments.
However, multiple fundamental factors should be analyzed in concert instead of just one, as they collectively influence market dynamics.
Trading indices using technical analysis
Technical analysis is a trading discipline employed to evaluate investments and identify trading opportunities by analyzing statistical trends gathered from trading activity, such as price movement and volume. When trading indices, technical analysts use a variety of tools, including chart patterns, candlestick patterns, and various indicators to predict future price movements.
-
Chart patterns: Chart patterns are formations within price charts that help predict future price movements. Common patterns include triangles, head and shoulders, and double tops and bottoms. Each pattern signifies potential market sentiment and likely price changes
-
Candlestick patterns: Candlestick patterns are used to gauge market emotions and future price movements. Patterns like doji, engulfing, and hammer provide insights into market trends and reversals
-
Indicators: Technical indicators are mathematical calculations based on the price, volume, or open interest of a security or contract. They can be classified into different types such as trend indicators, momentum indicators, volatility indicators, and volume indicators
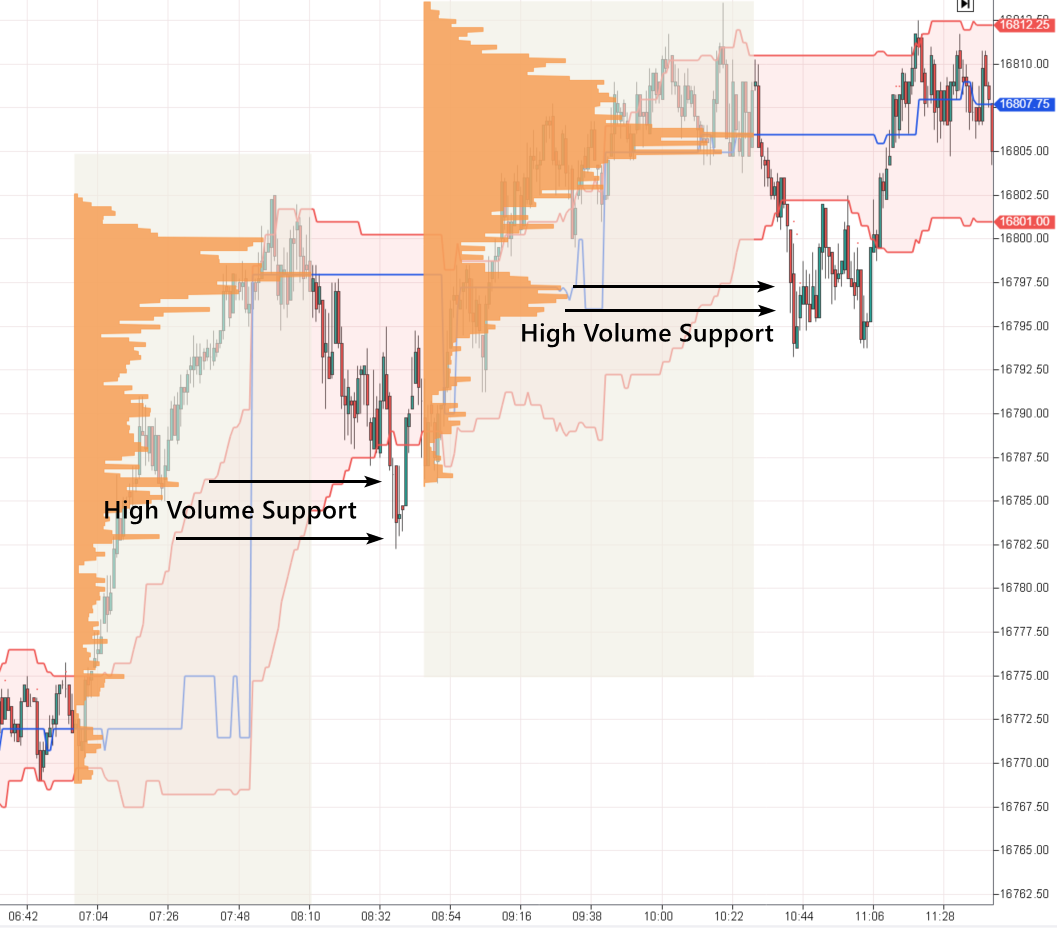
Trading indices using Volume Profile
The provided image illustrates a technical analysis scenario using volume profile indicators. In this chart, two distinct areas are highlighted as 'High Volume Support.' These areas represent price levels where a significant amount of trading activity has occurred, suggesting strong support or resistance at these levels. Traders often look for such areas as they can act as pivotal points for entering or exiting trades. For instance, a trader might interpret these high-volume areas as potential bounce points for the index price and may decide to place trades around these zones based on their trading strategy.
The shaded areas extending to the right represent the volume profile, indicating where the bulk of trading activity took place at various price levels. Traders can use this information to identify the price levels that are most significant to market participants, which can serve as targets or stop levels for trades.
In essence, technical analysis provides traders with a visual representation of market behavior, which can be invaluable for making informed trading decisions in index markets.
What is the best time to trade indices?
The best time to trade indices can vary depending on the specific index and the trader's strategy. Market volatility, trading volume, and economic events can all influence the optimal trading window.
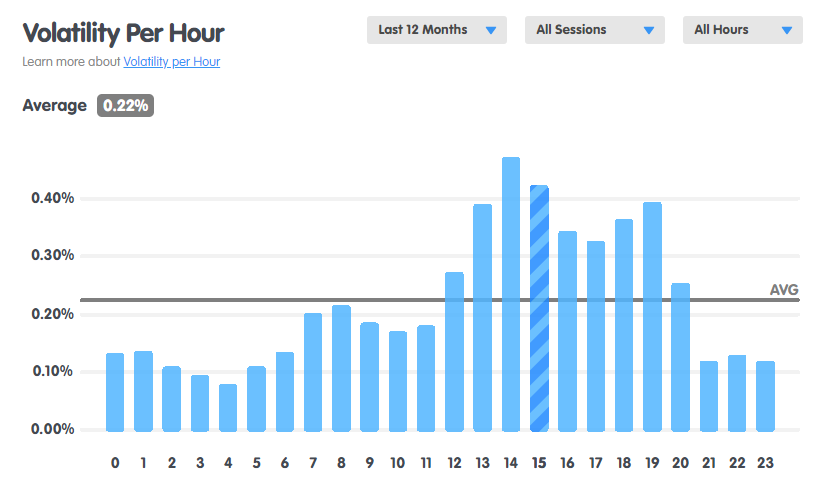
Increased volatility during the US trading session
The provided chart shows the average volatility per hour for the S&P 500 over the last 12 months, measured in UTC+0 time. The graph indicates that the average volatility stands at 0.22%. The bars represent the percentage volatility for each hour of the day.
From the chart, it's evident that the hours with the highest volatility, and hence potentially the most opportunity for traders, are concentrated around the middle of the trading day, afternoon. Specifically, there is a noticeable increase in volatility starting around the 12th hour (12 PM UTC), peaking around the 14th hour (2 PM UTC), and the volatility remains high for a few hours until a steep decline at the 20th hour and another one at the 21st hour (8 PM and 9 PM UTC respectively).
The hours of highest volatility correlate with the opening of the U.S. markets, where the S&P 500 is based, indicating increased trading activity during these hours.
This data suggests that traders looking for more movement and potentially greater opportunities may prefer to trade the S&P 500 during these peak hours. Conversely, those seeking a less volatile environment might choose different times.
Who is index trading good for?
Index trading is a versatile approach to the markets, adaptable to a variety of trading personas. Each trader's goals and lifestyle influence whether index trading is a suitable endeavor for them.
-
Full-time trader: For those who dedicate their entire workday to the markets, index trading can be a full-time profession. Full-time traders can benefit from the ability to monitor the markets closely, respond to economic events as they happen, and manage multiple trades at once
-
Proprietary (prop) trader: Prop traders operate with a firm's capital, taking on high-stakes trades to capitalize on short-term market movements. Indices offer the high volume and liquidity that prop traders need to execute large trades quickly and efficiently
-
Additional income: Individuals looking to supplement their income may find index trading appealing. With the flexibility to trade across global markets and time zones, part-time traders can find opportunities that align with their availability outside of traditional working hours
-
Other options:
-
a. Retirement savings: Investors focused on building their retirement portfolio may use index funds or ETFs as a way to gain exposure to the stock market's growth over time with less volatility than picking individual stocks
-
b. Hedging strategies: For those looking to hedge other investments, index trading can provide a counterbalance to individual stock holdings, potentially reducing portfolio risk
-
c. Educational purposes: Beginners or students of the market can use index trading as a learning tool to understand market trends and economic indicators without the complexities of individual stock selection
-
Index trading caters to a broad audience, from the active day trader to the passive investor, offering various instruments and approaches to suit different financial goals and risk appetites
How to start trading indices
Starting with index trading requires a foundation built on education and strategic planning:
-
Learn the basics: Acquaint yourself with market terminology, index constituents, and trading principles. A solid understanding of the financial markets is crucial
-
Choose the broker: Select a reputable broker suited to your trading needs. Utilize resources such as our article on How to choose a broker wisely to make sure you’re making the right choice
-
Open and fund your account: Once you've chosen your broker, open a trading account and deposit funds to start trading
-
Build a strategy: Develop a trading plan tailored to your risk tolerance, investment goals, and time horizon. Whether you're day-trading or investing long-term, a clear strategy is essential
-
Execute your plan, and control your risks: Implement your trading strategy with discipline. Use risk management tools like stop-loss orders to protect your capital
Summary
Index trading is a journey of calculated decisions and disciplined investment practices. It's not a shortcut to wealth but a methodical path to potentially profitable trading. With the right knowledge, broker, and strategy, one can navigate the indices market's ebbs and flows.
Remember, success in trading is not just about the returns, it's also about managing risks and maintaining a steady course through the market's inherent volatility.


Team that worked on the article

Vuk stands at the forefront of financial journalism, blending over six years of crypto investing experience with profound insights gained from navigating two bull/bear cycles. A dedicated content writer, Vuk has contributed to a myriad of publications and projects. His journey from an English language graduate to a sought-after voice in finance reflects his passion for demystifying complex financial concepts, making him a helpful guide for both newcomers and seasoned investors.

Dr. BJ Johnson is a PhD in English Language and an editor with over 15 years of experience. He earned his degree in English Language in the U.S and the UK. In 2020, Dr. Johnson joined the Traders Union team. Since then, he has created over 100 exclusive articles and edited over 300 articles of other authors.

Tobi Opeyemi Amure is an editor and expert writer with over 7 years of experience. In 2023, Tobi joined the Traders Union team as an editor and fact checker, making sure to deliver trustworthy and reliable content. The topics he covers include trading signals, cryptocurrencies, Forex brokers, stock brokers, expert advisors, binary options.
Tobi Opeyemi Amure motto: The journey of a thousand miles begins with a single step.