How To Read Forex Charts?


Editorial Note: While we adhere to strict Editorial Integrity, this post may contain references to products from our partners. Here's an explanation for How We Make Money. None of the data and information on this webpage constitutes investment advice according to our Disclaimer.
Reading Forex charts involves understanding the different types of charts, such as line, bar, and candlestick charts, which display price movements over time. Key elements include identifying trends, support and resistance levels, and using indicators to analyze and predict market behavior. Candlestick patterns provide visual insights into market sentiment and potential reversals. By mastering these components, traders can make informed decisions.
Understanding Forex charts is a fundamental skill for any trader. In this beginner's guide, we'll look at the main types of charts, key indicators, and effective strategies. Follow our tips to confidently analyze the market and make informed trading decisions.
How to read Forex charts: comprehensive guide
Forex charts are a fundamental tool for analyzing the movements of currency pairs in the foreign exchange market. They provide a visual representation of price changes over a specified period, allowing traders to make informed trading decisions.
Forex chart analysis basics
Analyzing Forex charts involves studying historical data and identifying trends, patterns, and key support and resistance levels. Traders use charts to pinpoint entry and exit points for trades and to determine potential market reversals. The primary elements of analysis include:
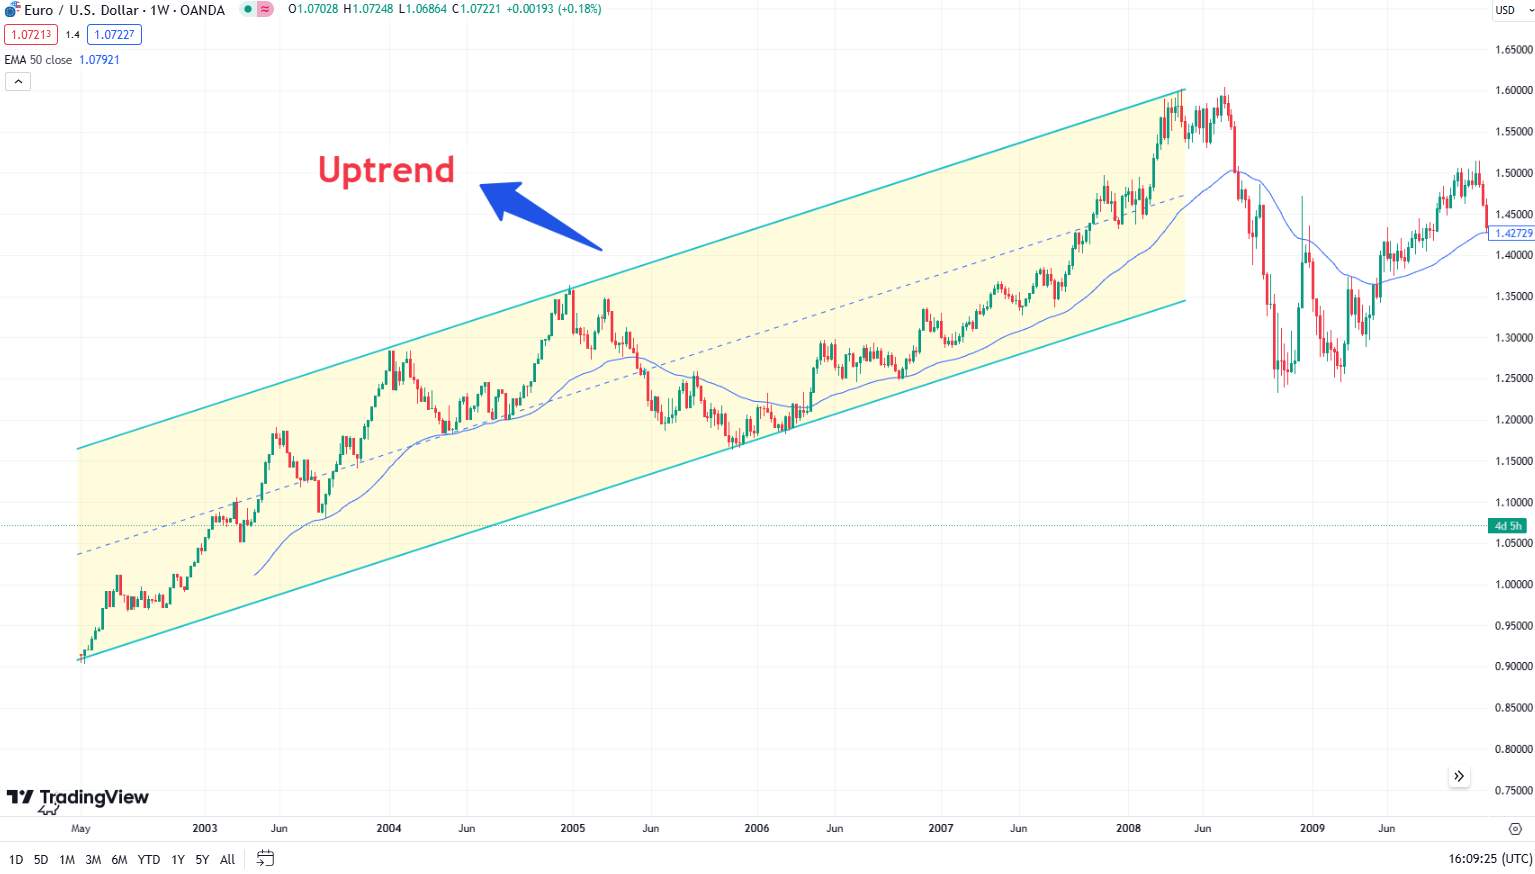
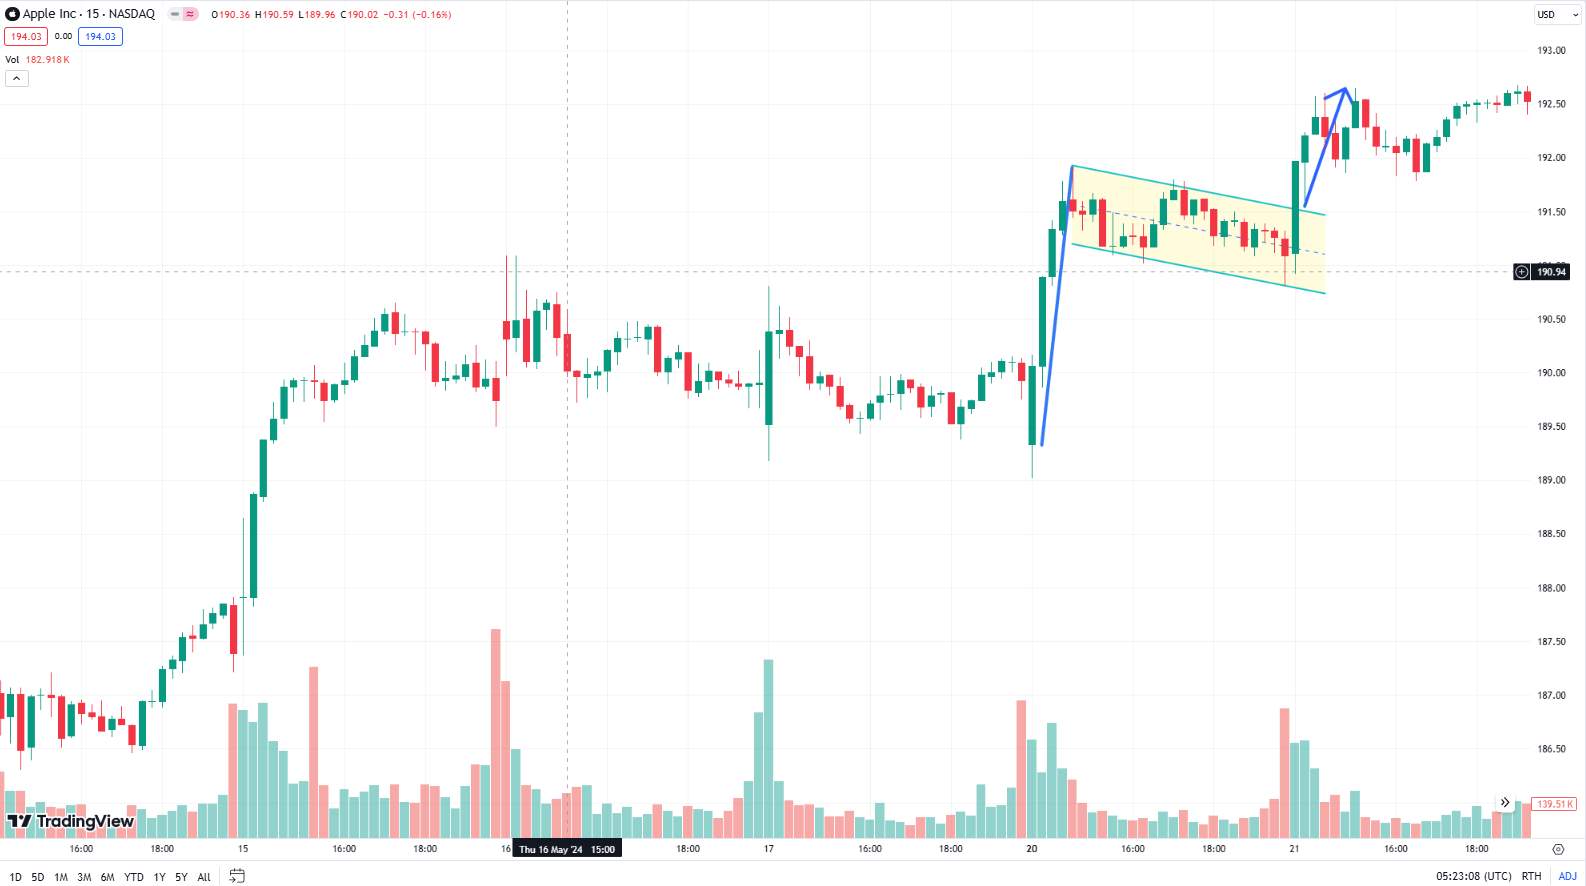
Trends: Recognizing trends is crucial. An upward trend suggests increasing prices, a downward trend indicates falling prices, and a sideways trend shows a stable market. Trends help traders forecast future price movements.

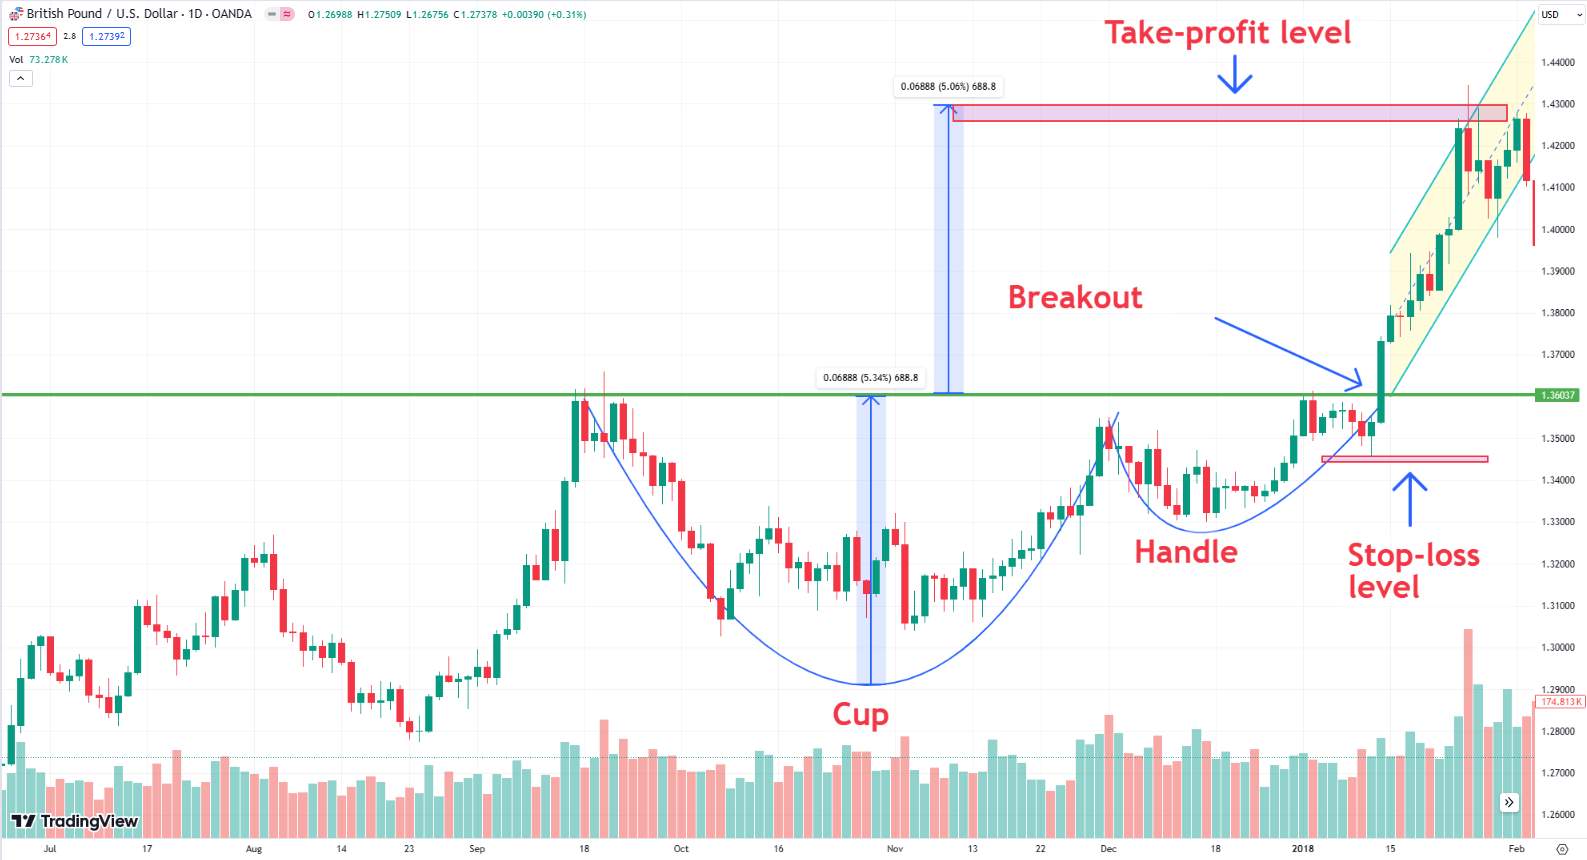
Patterns: Chart patterns like "head and shoulders," "flag," or "cup and handle" signal potential trend reversals or continuations. Identifying these patterns helps traders predict market movements.
Indicators: Technical indicators such as moving averages, Relative Strength Index (RSI), Bollinger bands and Moving Average Convergence Divergence (MACD) provide additional insights. They help confirm trends and refine trading strategies.
Understanding line, candlestick and bar charts in Forex trading
There are several types of Forex charts, each with its own characteristics and uses:
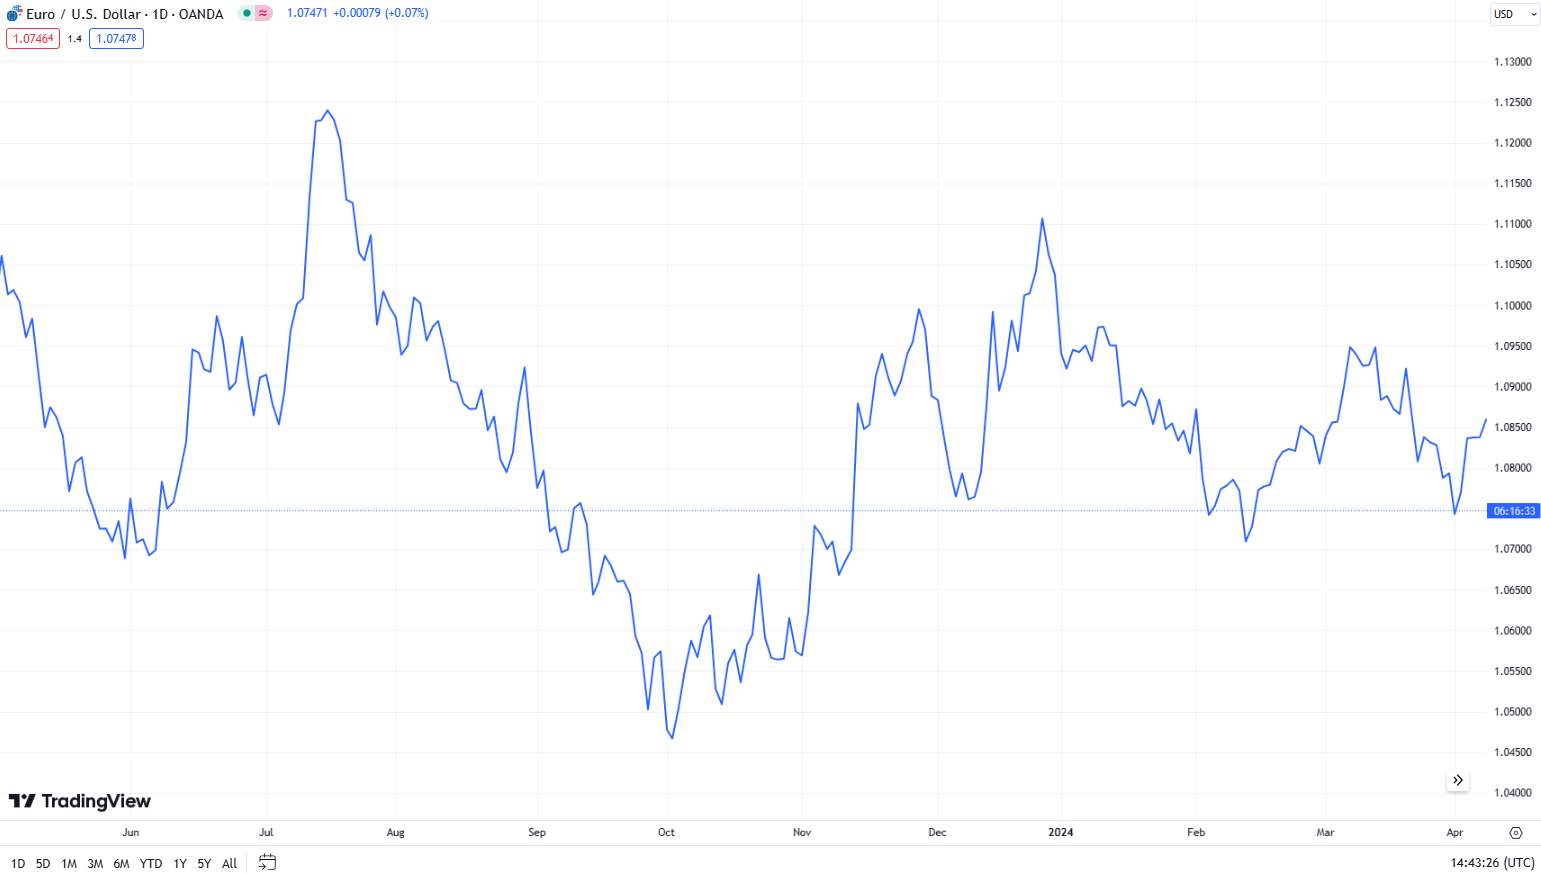
Line Charts display a sequence of closing prices over a chosen time period. It is simple to use and provides a general view of market direction. Suitable for quick analysis and trend identification.
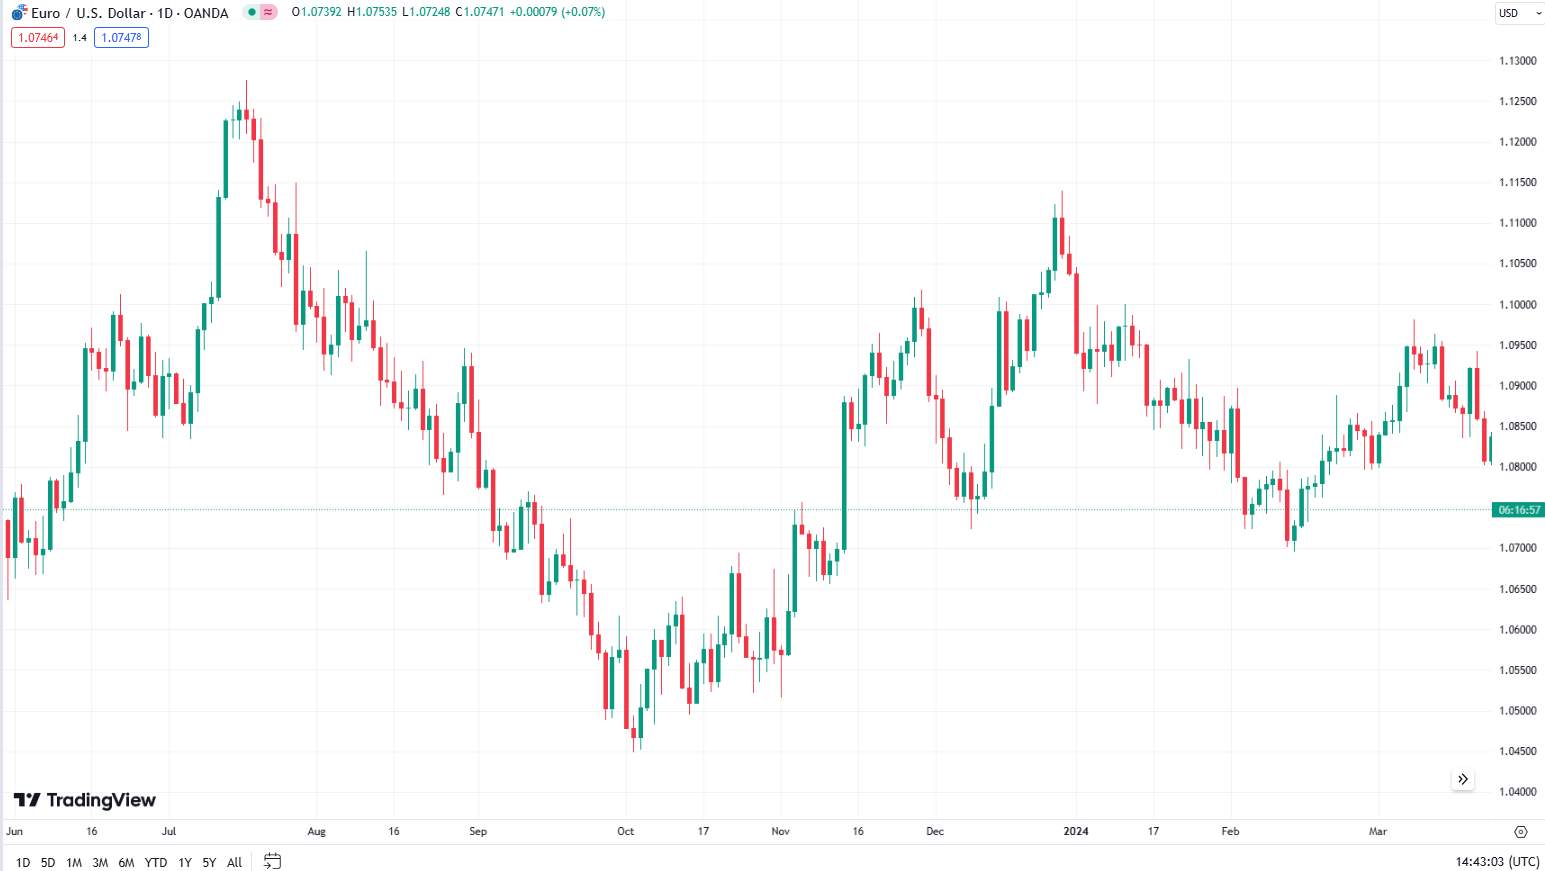
Candlestick Charts show the opening, closing, high, and low prices for a specific period in the form of "candles." They provide more information than line charts, allowing traders to see market sentiment. Popular due to their visual clarity and ability to display patterns.
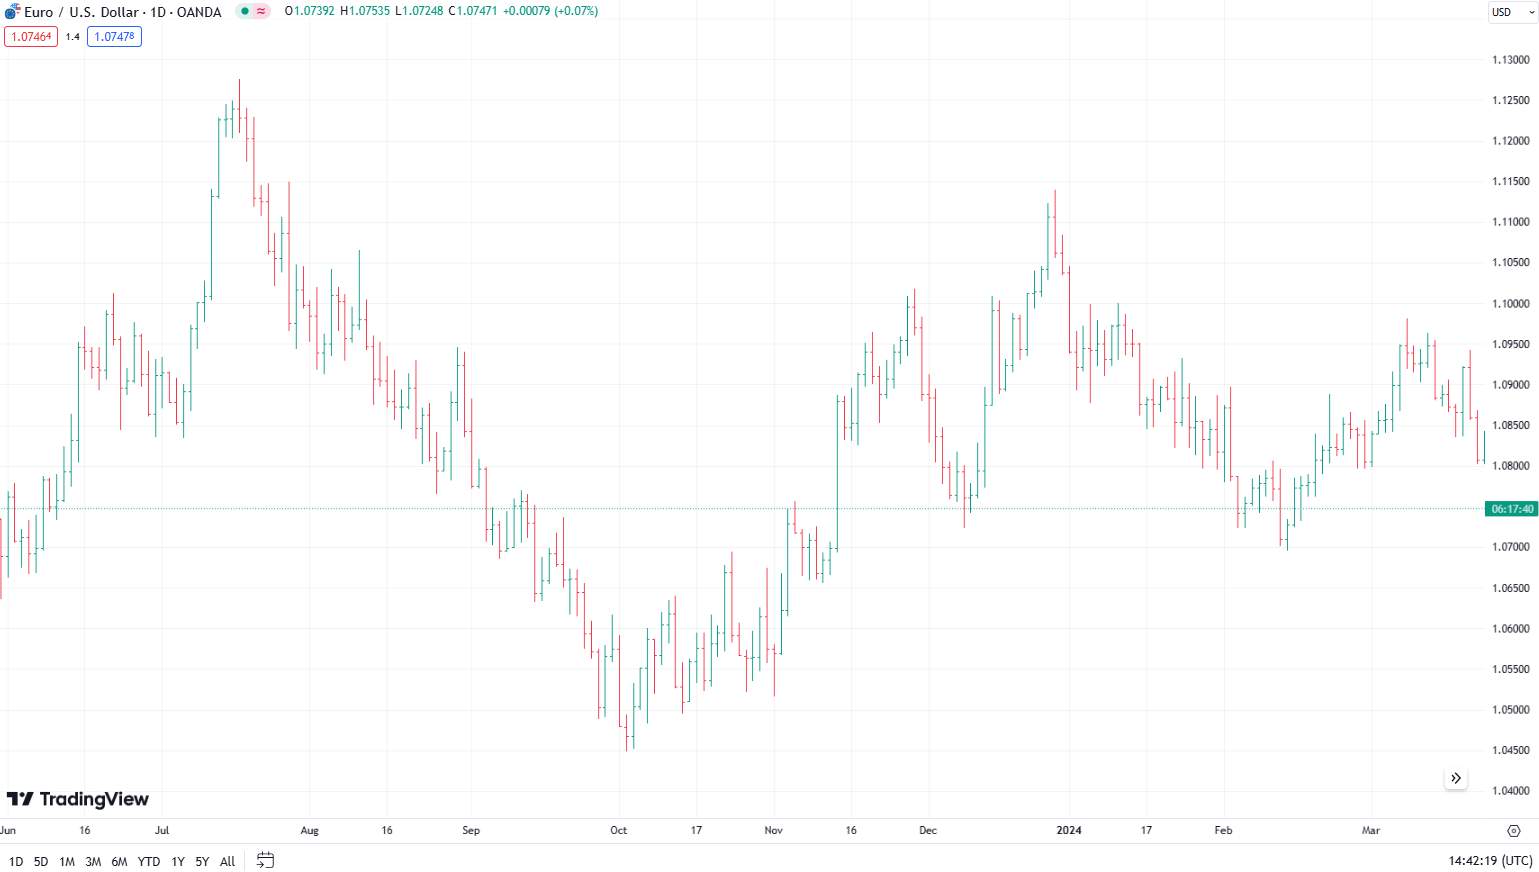
Bar Charts also show the opening, closing, high, and low prices, but in the form of vertical lines with horizontal ticks. They are more detailed than line charts but less visually intuitive than candlestick charts. Bar charts are used for precise analysis of price changes and volatility.
Tools and indicators
In order to make profitable trades in the Forex market, you need to be able to read charts and interpret them correctly. There are technical indicators for this. Let's take a look at the most popular technical indicators that traders use in their operations.
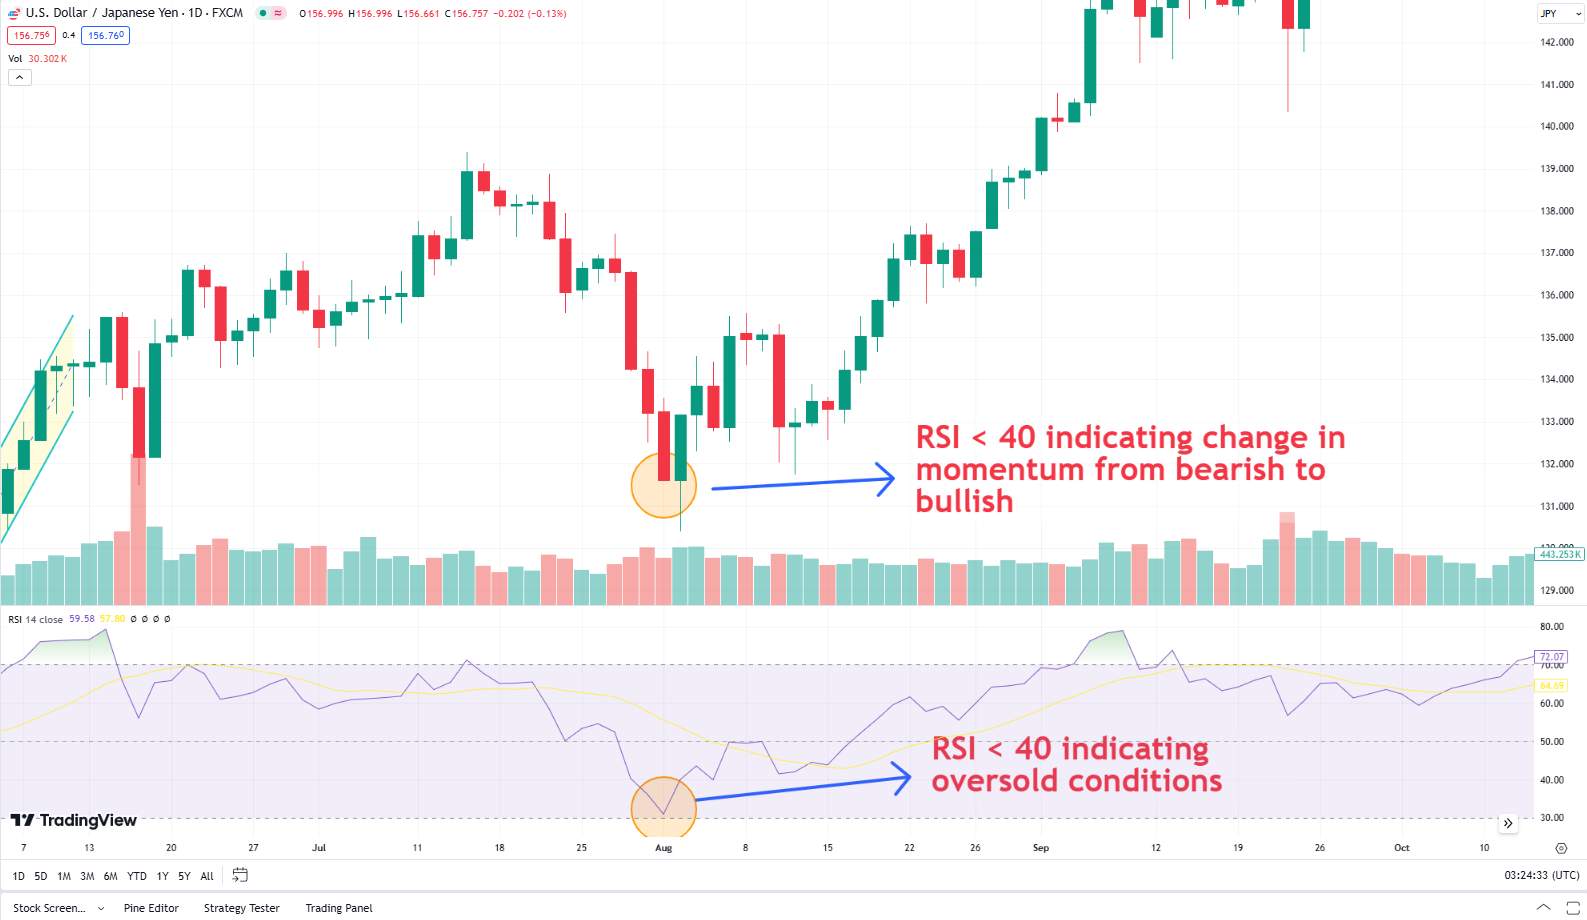
RSI (Relative strength index)
The RSI measures the speed and change of price movements, with values ranging from 0 to 100.
Interpretation:
Above 70: Indicates overbought conditions, suggesting the price might decline soon.
Below 30: Indicates oversold conditions, suggesting the price might increase soon.
Between 30 and 70: Considered neutral, indicating neither overbought or oversold conditions.

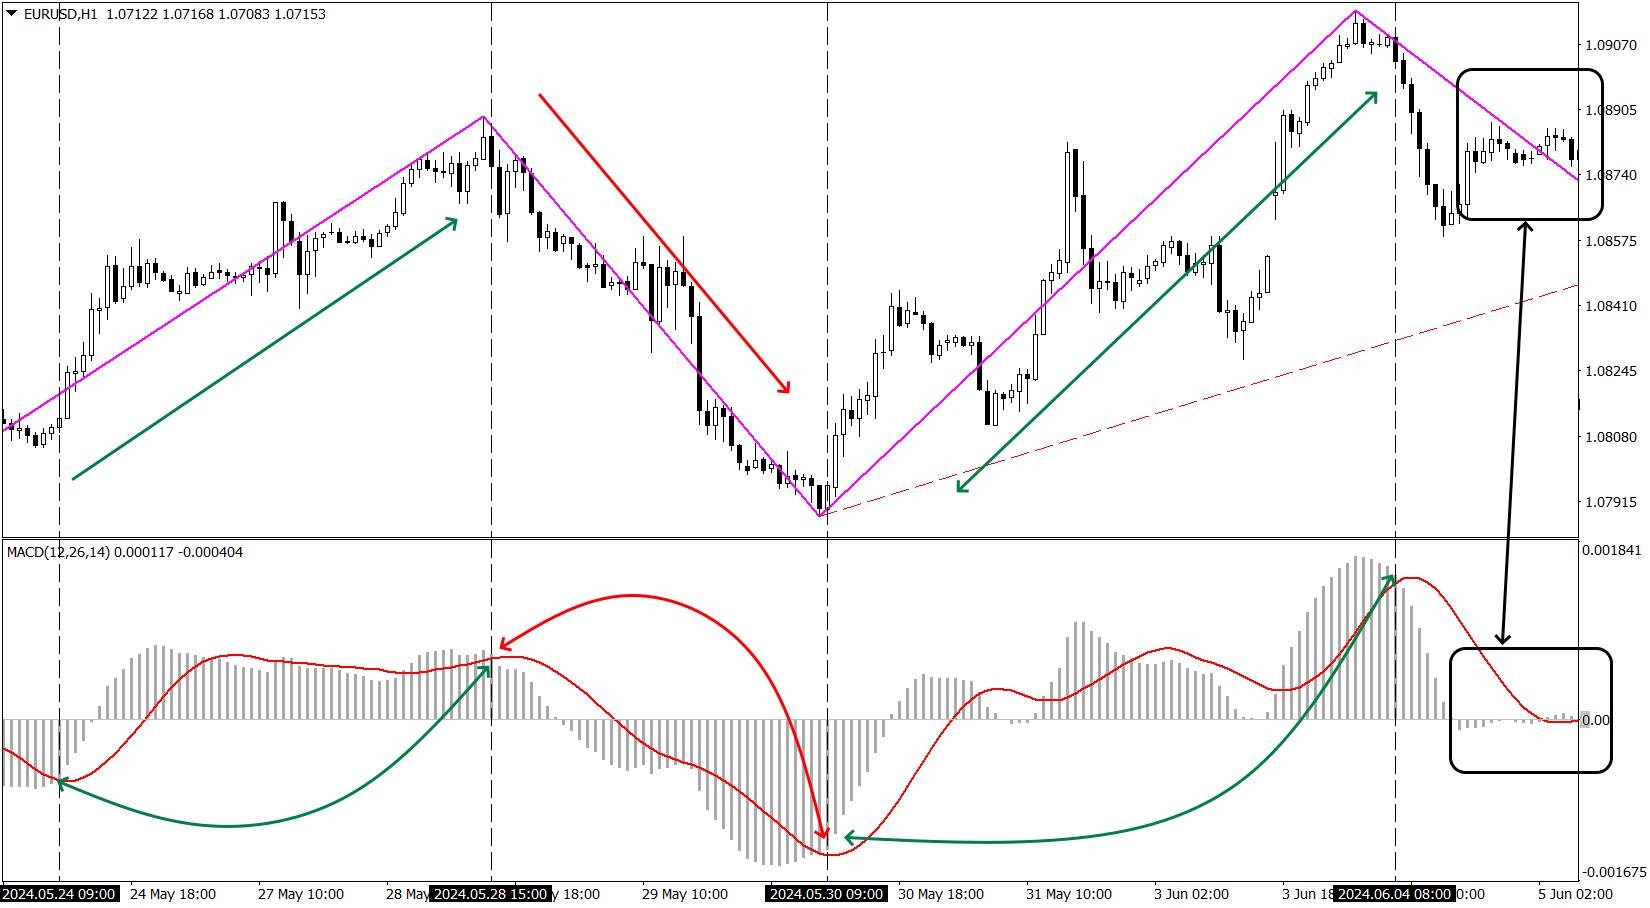
MACD (Moving average convergence divergence)
The MACD is based on the difference between two moving averages (typically 12-day and 26-day).
Interpretation:
MACD Line Crosses Signal Line from Above: This is a sell signal, indicating the trend might reverse downwards.
MACD Line Crosses Signal Line from Below: This is a buy signal, indicating the trend might reverse upwards.
MACD Histogram: Shows the difference between the MACD line and the signal line, helping assess the strength of the signal.
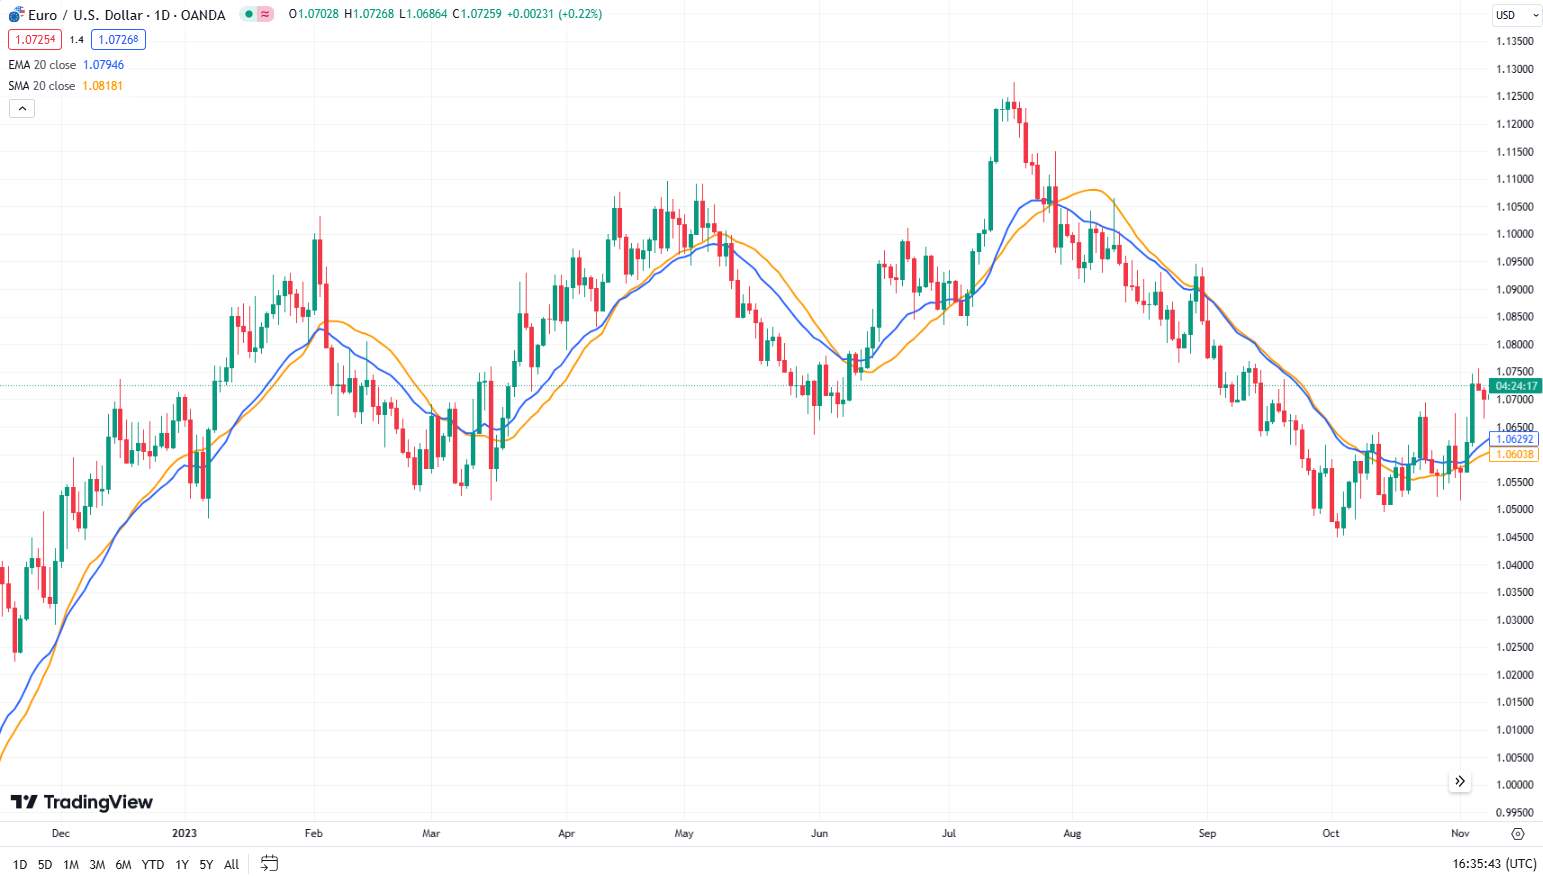
Moving Averages
Moving averages smooth out price data to help identify trends. The main types are Simple Moving Average (SMA) and Exponential Moving Average (EMA).
Interpretation:
Price Crosses Moving Average from Below: Indicates a potential buy signal.
Price Crosses Moving Average from Above: Indicates a potential sell signal.
Crossover of Short-term and Long-term Moving Averages: When a short-term moving average crosses above a long-term moving average, it signals a trend change upwards (Golden Cross). When it crosses below, it signals a trend change downwards (Death Cross).
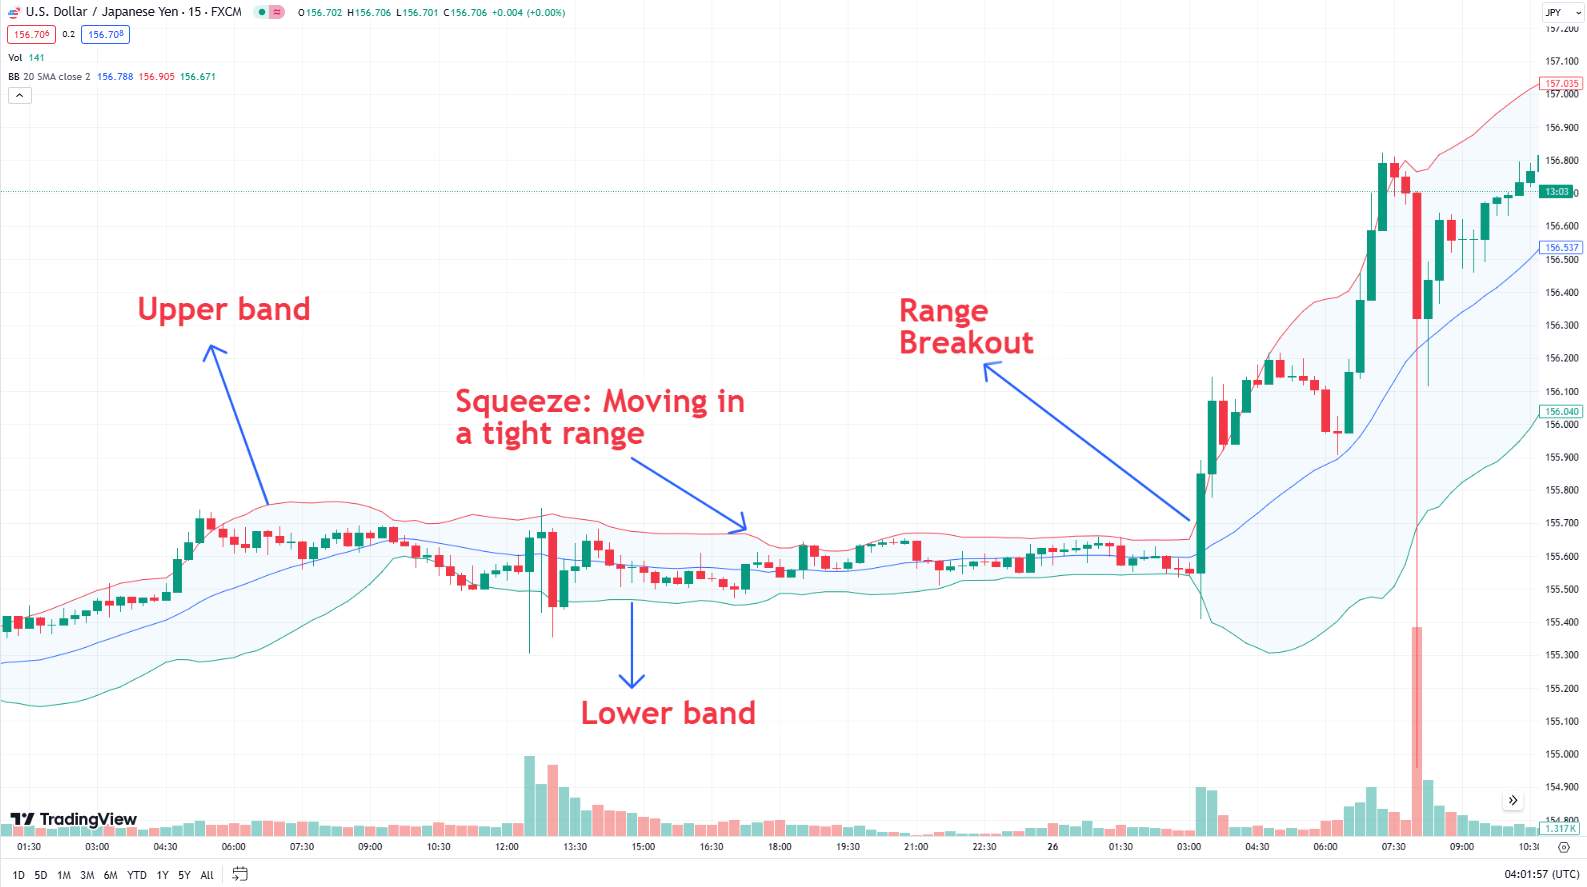
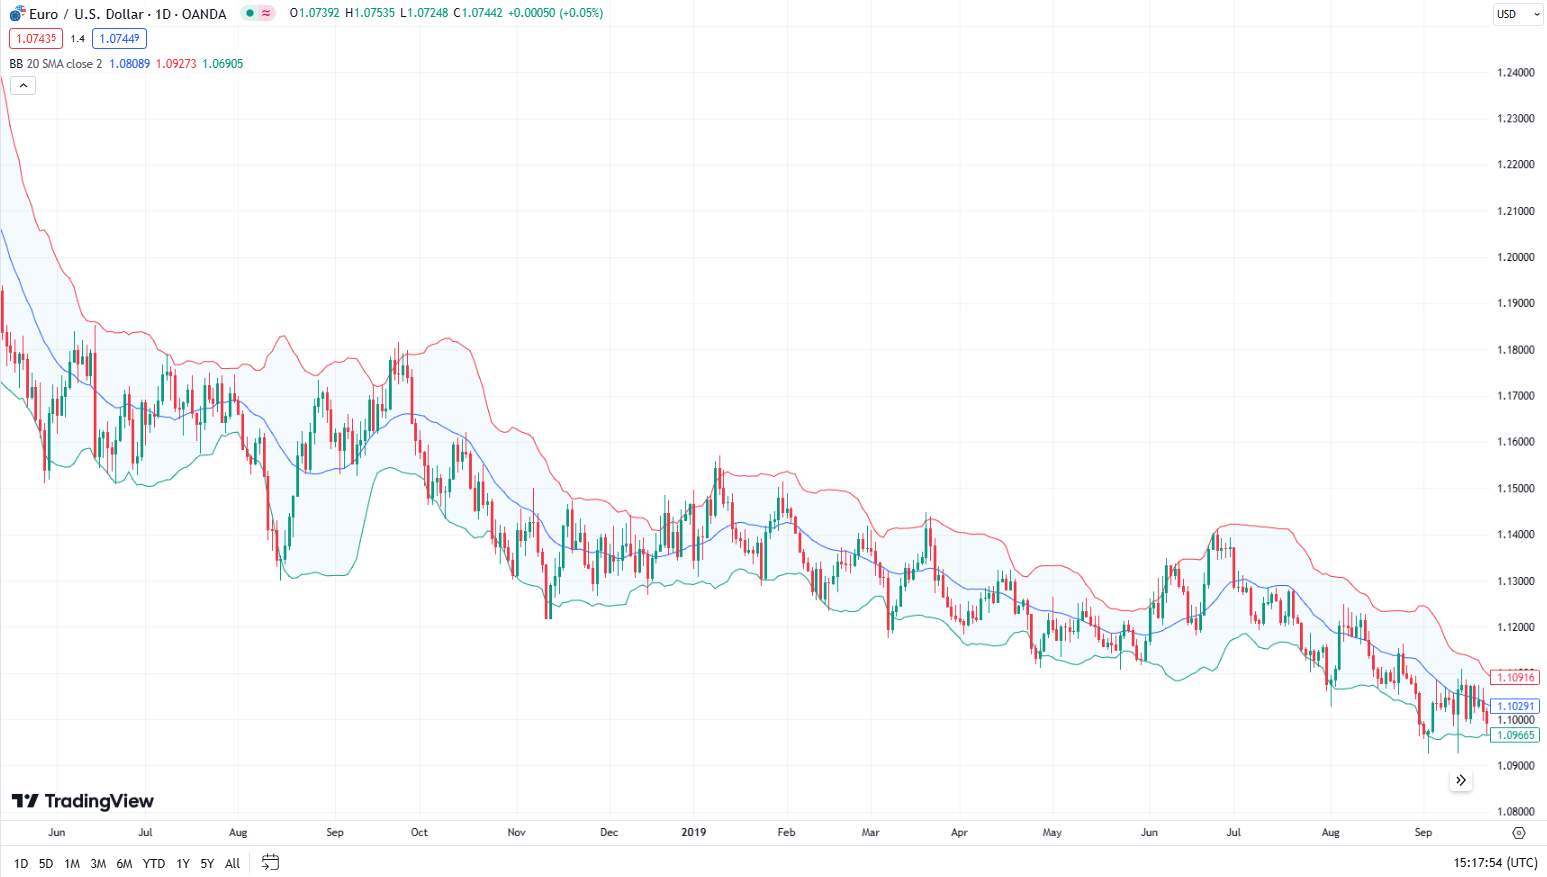
Bollinger Bands
Bollinger Bands consist of a moving average and two bands plotted at standard deviation levels above and below it.
Interpretation:
Touching Upper Band: Indicates overbought conditions, suggesting a potential price drop.
Touching Lower Band: Indicates oversold conditions, suggesting a potential price rise.
Band Narrowing: Signals low volatility and a potential breakout, indicating the price might move significantly once it breaks out of the narrow band.
Stochastic Oscillator
The Stochastic Oscillator measures the relative position of the closing price within a price range over a set period.
Interpretation:
Above 80: Indicates overbought conditions, suggesting a potential price drop.
Below 20: Indicates oversold conditions, suggesting a potential price rise.
%K and %D Line Crossovers: When the %K line crosses above the %D line, it’s a buy signal. When the %K line crosses below the %D line, it’s a sell signal.

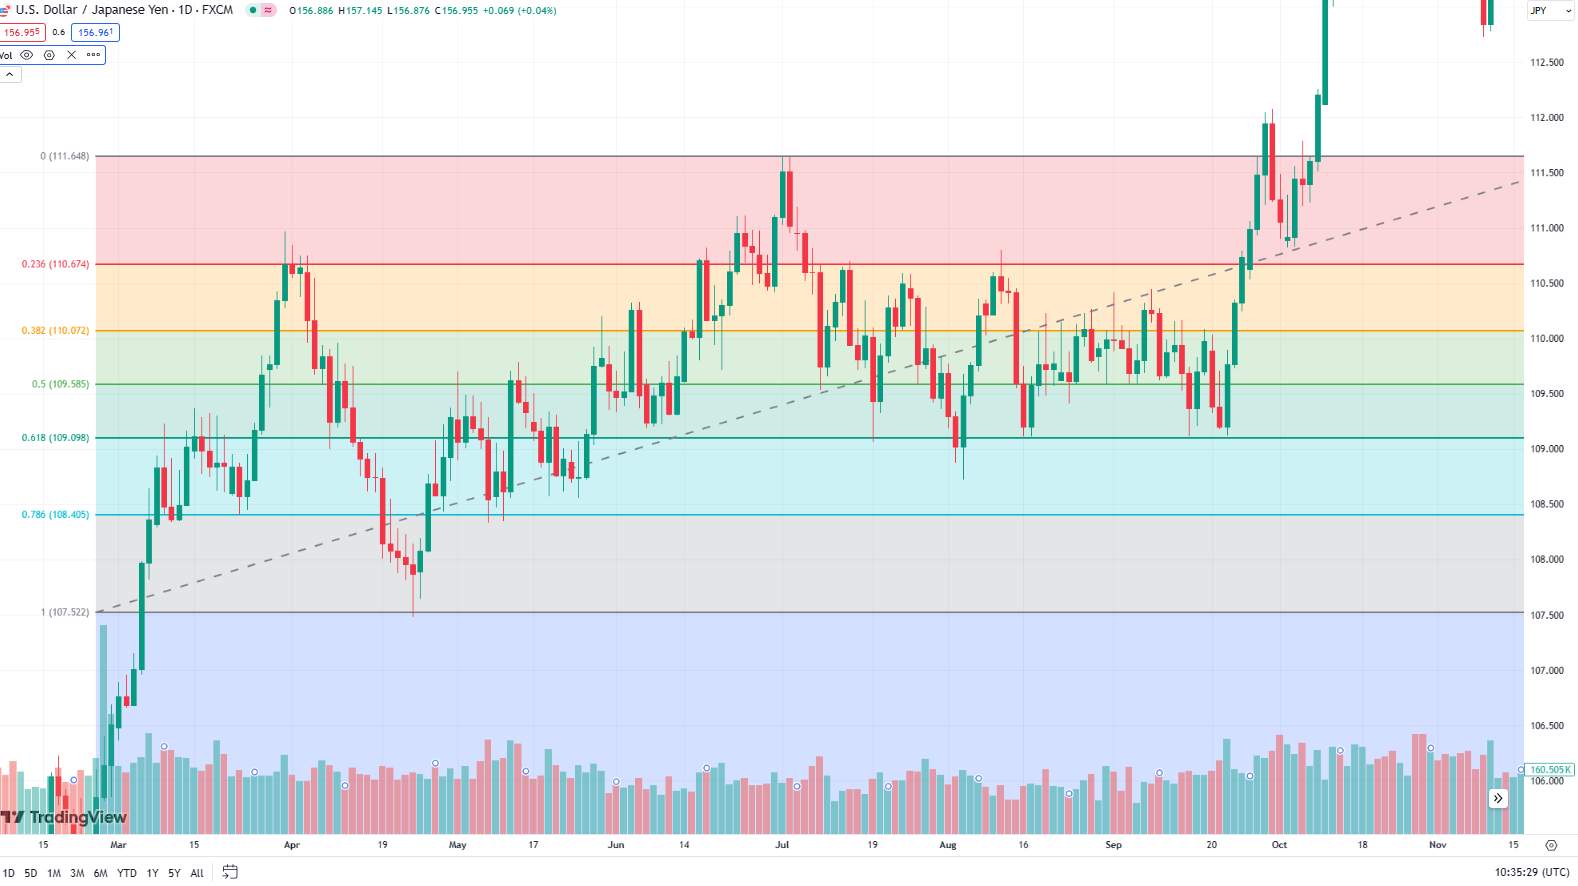
Fibonacci Retracement
Fibonacci retracement levels are based on key ratios (23.6%, 38.2%, 50%, 61.8%, 100%) derived from the Fibonacci sequence.
Interpretation:
Identifying Support and Resistance Levels: Traders use these levels to identify potential areas where the price might find support (stop falling) or resistance (stop rising). For example, if a price retraces to the 38.2% level and then resumes its original trend, this level acts as support or resistance.
How to use Forex charts for trading
Based on reading and interpretation of charts, traders build effective trading strategies. By following these trading strategies, traders achieve high returns and increase their capital. Let's look at several popular trading strategies:
Trend Following Strategy
The trend following strategy involves trading in the direction of a stable trend. Traders identify the trend using tools like moving averages or trendlines. Once a key level, such as the neckline in a head and shoulders pattern, is broken, they enter a trade in the direction of the trend. For a short position, this means entering after the neckline breaks, with stop-loss orders placed above the shoulder level to manage risk.
Breakout Strategy
The breakout strategy focuses on trading when key support or resistance levels are breached. Traders identify these levels using historical data and wait for the price to break through with confirmation from increased volume or other indicators. After the support level breaks, they enter a short position and set stop-loss orders above the previous peak to protect against false breakouts.
Counter-Trend Strategy
The counter-trend strategy involves trading against the current market trend in anticipation of a reversal. Traders first identify the prevailing trend using tools like moving averages or trendlines. Next, they spot potential reversal points, such as historical support/resistance levels, Fibonacci retracement levels, or overbought/oversold conditions indicated by RSI or Stochastic Oscillator. They then wait for confirmation signals, such as specific candlestick patterns or indicator divergences. For a long position in a downtrend, traders wait for the price to break above a resistance level formed by previous lows. For a short position in an uptrend, they wait for the price to break below a support level formed by previous highs. Stop-loss orders are set below the most recent low for long positions and above the most recent high for short positions. Profit targets are determined based on previous support/resistance levels, a fixed risk-reward ratio, or trailing stops to lock in profits.
We have selected reliable brokers that are convenient for implementing and testing your strategies. These companies provide high-quality brokerage and a wide range of trading instruments, such as stocks, bonds, cryptocurrencies, and other equally interesting offers.
| Demo | Min. deposit, $ | Max. leverage | Min Spread EUR/USD, pips | Negative balance protection | Open account | |
|---|---|---|---|---|---|---|
| Yes | 100 | 1:300 | 0,5 | Yes | Open an account Your capital is at risk. |
|
| Yes | No | 1:500 | 0,5 | Yes | Open an account Your capital is at risk.
|
|
| Yes | No | 1:200 | 0,1 | Yes | Open an account Your capital is at risk. |
|
| Yes | 100 | 1:50 | 0,7 | Yes | Study review | |
| Yes | No | 1:30 | 0,2 | Yes | Open an account Your capital is at risk. |
Begin with the study of different chart types

As an experienced trader, I can say that understanding Forex charts is a key skill for successful trading. I recommend beginning with the study of different chart types. Line charts are useful for an overall view of trends, while candlestick charts provide detailed information on market sentiment. Mastering indicators such as RSI, MACD, and moving averages will help you make informed decisions. For example, RSI helps identify overbought and oversold levels.
It's also important to consider trading psychology. Emotions can greatly influence your decisions, so control your feelings and stick to your strategy.
My advice to beginners is to experiment with methods and tools but be mindful of risks and use demo accounts for practice. Successful trading requires time and continuous learning, so be patient and persistent.
Conclusion
We have given basic information on how to read Forex charts for novice traders. By understanding different types of charts such as line, candlestick, and bar charts, beginners can gain a clearer understanding of price trends and patterns. The guide's in-depth coverage of key indicators such as RSI, MACD and moving averages further enhances a trader's ability to make informed decisions. Practical examples illustrate how these tools can be effectively applied in real-life trading scenarios. By emphasizing a combination of different analysis methods, the guide ensures that traders can approach the Forex market with confidence. This guide serves as a valuable starting point for anyone who wants to build a solid foundation in Forex trading.
FAQs
What time intervals are most often used on Forex charts, and how do they affect the analysis?
Time intervals such as 1 minute, 5 minutes, 1 hour, daily and weekly charts are often used in Forex. Short-term intervals are suitable for intraday trading, while long-term ones are suitable for trend analysis and strategic planning.
What mistakes do new traders often make when analyzing Forex charts?
Beginner traders often overestimate the significance of each price movement, use too many indicators, ignore fundamental factors and do not manage risk. Graphical analysis is only part of the overall strategy.
How does a trader's psychology influence the interpretation of Forex charts?
Trader psychology plays an important role in chart interpretation. Emotions such as fear and greed can distort market perceptions. Successful traders learn to control their emotions, stick to a strategy, and not react impulsively to fluctuations.
What indicators can be used on Forex charts?
There are many indicators that can be used on Forex charts, including Moving Averages, Relative Strength Index (RSI), Stochastic, Bollinger Bands, and others. These indicators help analyze the market and predict its movements.
Related Articles
Team that worked on the article
Parshwa is a content expert and finance professional possessing deep knowledge of stock and options trading, technical and fundamental analysis, and equity research. As a Chartered Accountant Finalist, Parshwa also has expertise in Forex, crypto trading, and personal taxation. His experience is showcased by a prolific body of over 100 articles on Forex, crypto, equity, and personal finance, alongside personalized advisory roles in tax consultation.
Dr. BJ Johnson is a PhD in English Language and an editor with over 15 years of experience. He earned his degree in English Language in the U.S and the UK. In 2020, Dr. Johnson joined the Traders Union team. Since then, he has created over 100 exclusive articles and edited over 300 articles of other authors.
Mirjan Hipolito is a journalist and news editor at Traders Union. She is an expert crypto writer with five years of experience in the financial markets. Her specialties are daily market news, price predictions, and Initial Coin Offerings (ICO).
Options trading is a financial derivative strategy that involves the buying and selling of options contracts, which give traders the right (but not the obligation) to buy or sell an underlying asset at a specified price, known as the strike price, before or on a predetermined expiration date. There are two main types of options: call options, which allow the holder to buy the underlying asset, and put options, which allow the holder to sell the underlying asset.
Day trading involves buying and selling financial assets within the same trading day, with the goal of profiting from short-term price fluctuations, and positions are typically not held overnight.
Volatility refers to the degree of variation or fluctuation in the price or value of a financial asset, such as stocks, bonds, or cryptocurrencies, over a period of time. Higher volatility indicates that an asset's price is experiencing more significant and rapid price swings, while lower volatility suggests relatively stable and gradual price movements.
Fundamental analysis is a method or tool that investors use that seeks to determine the intrinsic value of a security by examining economic and financial factors. It considers macroeconomic factors such as the state of the economy and industry conditions.
Forex leverage is a tool enabling traders to control larger positions with a relatively small amount of capital, amplifying potential profits and losses based on the chosen leverage ratio.

-
 Afghanistan
-
 Albania
-
 Algeria
-
 Argentina
-
 Armenia
-
 Australia
-
 Austria
-
 Azerbaijan
-
 Bahamas
-
 Bahrain
-
 Bangladesh
-
 Belgium
-
 Botswana
-
 Brazil
-
 Brunei
-
 Bulgaria
-
 Burma
Burma
-
 Cambodia
-
 Cameroon
-
 Canada
-
 Chile
Chile
-
 China
China
-
 Colombia
-
 Costa Rica
-
 Cote d'Ivoire
-
 Croatia
-
 Cyprus
-
 Czech Republic
-
 Denmark
-
 Dominican Republic
-
 Ecuador
-
 Egypt
Egypt
-
 Estonia
-
 Eswatini
-
 Ethiopia
-
 Finland
-
 France
-
 Georgia
-
 Germany
-
 Ghana
Ghana
-
 Greece
-
 Haiti
Haiti
-
 Hong Kong
-
 Hungary
-
 India
India
-
 Indonesia
-
 Iran, Islamic republic
-
 Iraq
Iraq
-
 Ireland
-
 Israel
-
 Italy
Italy
-
 Jamaica
-
 Japan
Japan
-
 Jordan
-
 Kazakhstan
-
 Kenya
Kenya
-
 Korea
Korea
-
 Kuwait
-
 Kyrgyzstan
-
 Laos
Laos
-
 Latvia
-
 Lebanon
-
 Libyan Arab Jamahiriya
-
 Lithuania
-
 Luxembourg
-
 Macedonia
-
 Madagascar
-
 Malaysia
-
 Malta
Malta
-
 Mauritius
-
 Mexico
-
 Moldova
-
 Mongolia
-
 Montenegro
-
 Morocco
-
 Mozambique
-
 Namibia
-
 Nepal
Nepal
-
 Netherlands
-
 Nigeria
-
 Norway
-
 Oman
Oman
-
 Pakistan
-
 Palestine
-
 Papua New Guinea
-
 Peru
Peru
-
 Philippines
-
 Poland
-
 Portugal
-
 Puerto Rico
-
 Qatar
Qatar
-
 Romania
-
 Rwanda
-
 Saudi Arabia
-
 Serbia
-
 Singapore
-
 Slovakia
-
 Slovenia
-
 Somalia
-
 South Africa
-
 Spain
Spain
-
 Sri Lanka
-
 Sweden
-
 Switzerland
-
 Syrian Arab Republic
-
 Taiwan
-
 Tajikistan
-
 Tanzania, United Republic Of
-
 Thailand
-
 Trinidad and Tobago
-
 Tunisia
-
 Turkey
-
 UAE
UAE
-
 Uganda
-
 Ukraine
-
 United Kingdom
-
United States
-
 Uzbekistan
-
 Venezuela
-
 Vietnam
-
 Yemen
Yemen
-
 Zambia
-
 Zimbabwe
- Forex
- Crypto

