The tweet was deleted by the author.
But we saved everything 🙂.

AvalonBay Communities reported significant achievements in 2024, including industry recognition and the opening of new communities.
The company also surpassed 10,000 volunteer hours during the year. AvalonBay Communities credited its associates for these accomplishments.
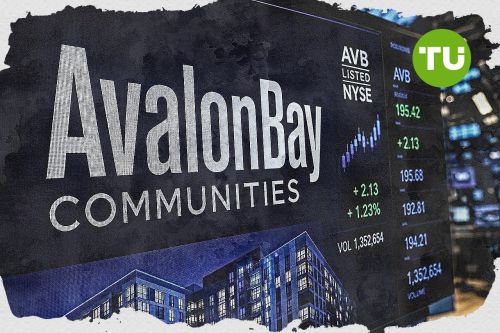
AVB is trading at $160.81, which is notably below the MA-20 ($170.09), MA-50 ($174.18), and MA-200 ($185.43), highlighting clear downside pressure across short-, medium-, and long-term timeframes. The Ichimoku Kijun level sits at $170.25, acting as immediate resistance above the current price. Near-term support is found at the MA-5 cluster ($162.94), with key support at MA-10 ($164.71). Immediate resistance is at the Ichimoku Kijun ($170.25), followed by a key resistance level at MA-50 ($174.18).
Momentum remains firmly negative as both the MACD (-5.13) and ADX (28.62) on D1 indicate strong selling pressure. RSI (28.75), Stoch RSI (13.39), and CCI (-113.94) all point to oversold conditions, while BBP (-2.61) confirms sellers are firmly in control. The Awesome Oscillator does not provide trend confirmation, holding a neutral stance. In today's session, AVB has declined 1.59%, testing weekly support and extending the prevailing bearish tone. AVB is trading at the very bottom of its weekly range, down from $161.37 a week ago, reflecting a weekly drop of 0.35%. Weekly volatility stands at 3.32%, marking a steady and persistent decline from recent highs.
Looking to the coming week, the expected price corridor is $157.00 to $165.00, situated at the lower end of the 52-week performance band with the 52-week low at $160.32 and high at $216.47. Based on the alignment of W1 signals (RSI, ADX, MACD, MA-50), the probability of a rise is very low (less than 20%), making further downside much more likely. The baseline scenario envisions AVB consolidating in this bottoming range as oversold conditions persist. A bullish outcome would require regaining and sustaining levels above $170.25. A bearish scenario could see AVB slipping below $160 to new yearly lows if support fails.

 Afghanistan
 Albania
 Algeria
 Angola
 Argentina
 Armenia
 Australia
 Austria
 Azerbaijan
 Bahamas
 Bahrain
 Bangladesh
 Belarus
 Belgium
 Bolivia
 Botswana
 Brazil
 Brunei
 Bulgaria
 Cambodia
 Cameroon
 Canada
 Chile
Chile
 China
China
 Colombia
 Congo
Congo
 Costa Rica
 Cote d'Ivoire
 Croatia
 Cuba
Cuba
 Cyprus
 Czechia
 DR Congo
 Denmark
 Dominican Republic
 Ecuador
 Egypt
Egypt
 El Salvador
 Estonia
 Eswatini
 Ethiopia
 Finland
 France
 Georgia
 Germany
 Ghana
Ghana
 Greece
 Haiti
Haiti
 Hong Kong
 Hungary
 India
India
 Indonesia
 Iran, Islamic republic
 Iraq
Iraq
 Ireland
 Israel
 Italy
Italy
 Jamaica
 Japan
Japan
 Jordan
 Kazakhstan
 Kenya
Kenya
 Korea
Korea
 Kuwait
 Kyrgyzstan
 Laos
Laos
 Latvia
 Lebanon
 Lesotho
 Libya
Libya
 Lithuania
 Luxembourg
 Madagascar
 Malaysia
 Malta
Malta
 Mauritius
 Mexico
 Moldova
 Mongolia
 Montenegro
 Morocco
 Mozambique
 Myanmar
 Namibia
 Nepal
Nepal
 Netherlands
 New Zealand
 Nigeria
 North Macedonia
 Norway
 Oman
Oman
 Pakistan
 Palestine
 Panama
 Papua New Guinea
 Paraguay
 Peru
Peru
 Philippines
 Poland
 Portugal
 Puerto Rico
 Qatar
Qatar
 Reunion
 Romania
 Rwanda
 Saudi Arabia
 Serbia
 Singapore
 Slovakia
 Slovenia
 Somalia
 South Africa
 Spain
Spain
 Sri Lanka
 Sweden
 Switzerland
 Syria
Syria
 Taiwan
 Tajikistan
 Tanzania
 Thailand
 Trinidad and Tobago
 Tunisia
 Turkey
 UAE
UAE
 Uganda
 Ukraine
 United Kingdom
United States
United Kingdom
United States
 Uruguay
 Uzbekistan
 Venezuela
 Vietnam
 Yemen
Yemen
 Zambia
 Zimbabwe