
AMD stock falls 1.46% as broader selling pressure hits sector

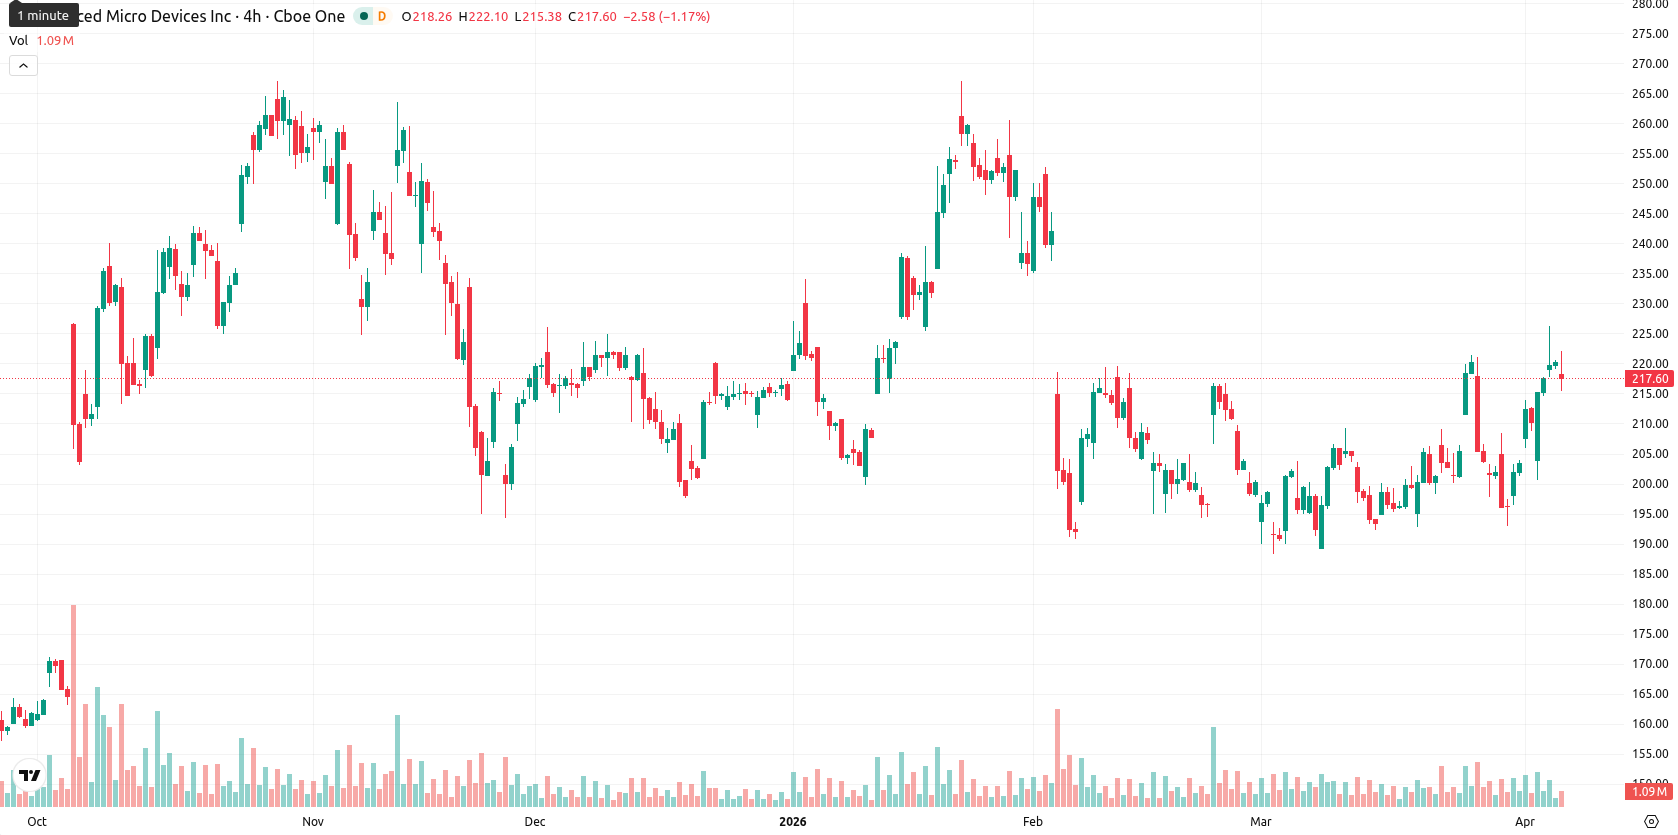
Advanced Micro Devices (AMD) is trading at $216.97, down 1.46% for the session, and remains well above its SMA-20 ($204.12), SMA-50 ($210.97), and SMA-200 ($197.35), indicating AMD is positioned in a clear bullish structure across all observed timeframes.
Highlights
- AMD has notified customers of server CPU price increases, which are set to be implemented in March and April.
- The company reported a significant server CPU market share of 41.3% in the fourth quarter, underscoring strong competitive positioning.
- Technically, AMD trades amid a bullish trend, with overbought signals and a projected five-day range of $214.00–$222.00 as short-term consolidation persists.
Customer price hikes and market share gains amid selling pressure
AMD communicated price increases to customers with implementation beginning in March and April. The company reported its server CPU market share at 41.3% in the fourth quarter. These developments were accompanied by broader selling pressure.
Mixed momentum as overbought signals clash with support strength
Technical indicators are mixed for AMD. The price is decisively above support from moving averages, with the Ichimoku Kijun on D1 providing immediate support at $207.25. MACD on the daily chart shows a neutral stance, and ADX indicates a weak trend, while CCI and BBP readings suggest overbought conditions. Stoch RSI is also flagged overbought, and RSI remains in buy territory; however, not all momentum indicators are aligned, creating a divergence in signals.
Short-term breakout risks as prices consolidate in defined range
In the near term, AMD is likely to remain within a volatility band between $214.00 and $222.00 over the next five trading days. Price action may consolidate in this range as recent support and resistance levels define short-term movement. A breakout above $222.00 could push the stock toward new short-term highs, while a drop below $214.00 would increase the risk of corrective downside; current trend indicators and weekly momentum still favor buyers.
Earlier, analysts noted that AMD was exhibiting strong bullish momentum, with technicals suggesting limited pullback risk despite signs of short-term overextension. The stock's resilience above key moving averages, even amid recent price increases and selling pressure, highlights a prevailing bullish structure—investors should monitor for a breakout beyond $222.00 as confirmation of renewed upward momentum.


Latest AMD News


-
 Afghanistan
-
 Albania
-
 Algeria
-
 Angola
-
 Argentina
-
 Armenia
-
 Australia
-
 Austria
-
 Azerbaijan
-
 Bahamas
-
 Bahrain
-
 Bangladesh
-
 Belarus
-
 Belgium
-
 Bolivia
-
 Botswana
-
 Brazil
-
 Brunei
-
 Bulgaria
-
 Cambodia
-
 Cameroon
-
 Canada
-
 Chile
Chile
-
 China
China
-
 Colombia
-
 Congo
Congo
-
 Costa Rica
-
 Cote d'Ivoire
-
 Croatia
-
 Cuba
Cuba
-
 Cyprus
-
 Czechia
-
 DR Congo
-
 Denmark
-
 Dominican Republic
-
 Ecuador
-
 Egypt
Egypt
-
 El Salvador
-
 Estonia
-
 Eswatini
-
 Ethiopia
-
 Finland
-
 France
-
 Georgia
-
 Germany
-
 Ghana
Ghana
-
 Greece
-
 Haiti
Haiti
-
 Hong Kong
-
 Hungary
-
 India
India
-
 Indonesia
-
 Iran, Islamic republic
-
 Iraq
Iraq
-
 Ireland
-
 Israel
-
 Italy
Italy
-
 Jamaica
-
 Japan
Japan
-
 Jordan
-
 Kazakhstan
-
 Kenya
Kenya
-
 Korea
Korea
-
 Kuwait
-
 Kyrgyzstan
-
 Laos
Laos
-
 Latvia
-
 Lebanon
-
 Lesotho
-
 Libya
Libya
-
 Lithuania
-
 Luxembourg
-
 Madagascar
-
 Malaysia
-
 Malta
Malta
-
 Mauritius
-
 Mexico
-
 Moldova
-
 Mongolia
-
 Montenegro
-
 Morocco
-
 Mozambique
-
 Myanmar
-
 Namibia
-
 Nepal
Nepal
-
 Netherlands
-
 New Zealand
-
 Nigeria
-
 North Macedonia
-
 Norway
-
 Oman
Oman
-
 Pakistan
-
 Palestine
-
 Panama
-
 Papua New Guinea
-
 Paraguay
-
 Peru
Peru
-
 Philippines
-
 Poland
-
 Portugal
-
 Puerto Rico
-
 Qatar
Qatar
-
 Reunion
-
 Romania
-
 Rwanda
-
 Saudi Arabia
-
 Serbia
-
 Singapore
-
 Slovakia
-
 Slovenia
-
 Somalia
-
 South Africa
-
 Spain
Spain
-
 Sri Lanka
-
 Sweden
-
 Switzerland
-
 Syria
Syria
-
 Taiwan
-
 Tajikistan
-
 Tanzania
-
 Thailand
-
 Trinidad and Tobago
-
 Tunisia
-
 Turkey
-
 UAE
UAE
-
 Uganda
-
 Ukraine
-
 United Kingdom
-
United States
-
 Uruguay
-
 Uzbekistan
-
 Venezuela
-
 Vietnam
-
 Yemen
Yemen
-
 Zambia
-
 Zimbabwe
- Forex
- Crypto
