
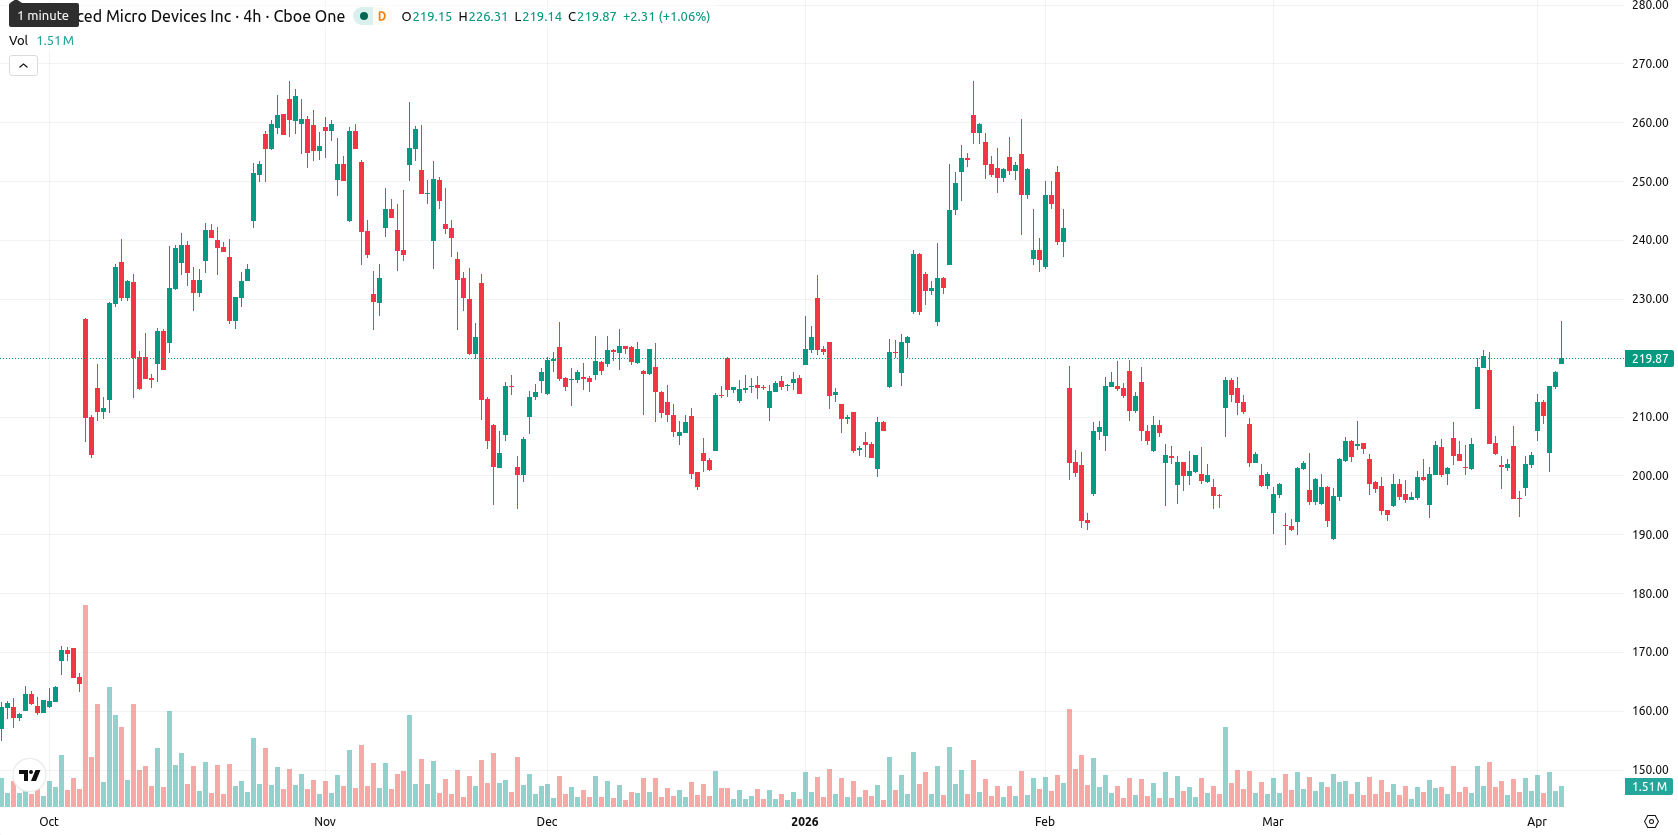
AMD stock gains 1.24% as price moves within the $218.00–$226.60 range

Advanced Micro Devices, Inc. (AMD) is trading at $220.21, up 1.24% on the session. The price remains firmly above its SMA-20 ($202.73), SMA-50 ($211.64), and SMA-200 ($196.88), reflecting strong bullish momentum versus short-, medium-, and long-term trend indicators.
Highlights
- AMD sustains bullish momentum, trading well above short-, medium-, and long-term average price levels.
- Momentum indicators show overbought conditions despite only mild trend strength, signaling potential divergence in near-term price action.
- Expected price range for the next five days is $218.00–$226.60, with a break above $226.60 likely to trigger further gains.
Overbought risk emerges as technical signals diverge near session highs
AMD is currently sustaining levels well above the SMA-20, SMA-50, and SMA-200, while the Ichimoku Kijun at $204.78 acts as immediate support. Momentum indicators are mixed: MACD on D1 is neutral yet leans bullish over shorter periods; ADX at 10.62 signals a weak trend; RSI sits at 57.57 highlighting buying interest, but both Stoch RSI (80.32) and CCI (134.11) signal overbought conditions. BBP at 11.89, also overbought, points to buyer dominance intraday. The Awesome Oscillator is neutral, and AMD is trading near the top of today’s $219.42 – $226.27 range, showing moderate volatility and strength toward session highs. However, some oscillators highlight overbought signals contrasting with milder overall momentum.
Upward bias persists as major indicators align with limited pullback risk
For the next five trading days, the typical volatility band for AMD is expected between $218.00 and $226.60. With three out of four major D1/W1 trend indicators in “Buy” or “Strong Buy,” there is a very high probability (over 80%) of continued upward movement, making a price pullback less likely. Baseline scenario: AMD consolidates between $218.00 and $226.60. A confirmed break above $226.60 could drive further gains, while a drop below $218.00 would indicate a corrective move as overbought signals unwind.
Earlier, analysts noted that AMD was exhibiting strong bullish momentum despite signs of short-term overextension. The current setup not only reaffirms this optimism but suggests that a sustained push above $226.60 could signal renewed upside, while any break below $218.00 may prompt a swift technical retracement as overbought signals are digested.


Latest AMD News


-
 Afghanistan
-
 Albania
-
 Algeria
-
 Angola
-
 Argentina
-
 Armenia
-
 Australia
-
 Austria
-
 Azerbaijan
-
 Bahamas
-
 Bahrain
-
 Bangladesh
-
 Belarus
-
 Belgium
-
 Bolivia
-
 Botswana
-
 Brazil
-
 Brunei
-
 Bulgaria
-
 Cambodia
-
 Cameroon
-
 Canada
-
 Chile
Chile
-
 China
China
-
 Colombia
-
 Congo
Congo
-
 Costa Rica
-
 Cote d'Ivoire
-
 Croatia
-
 Cuba
Cuba
-
 Cyprus
-
 Czechia
-
 DR Congo
-
 Denmark
-
 Dominican Republic
-
 Ecuador
-
 Egypt
Egypt
-
 El Salvador
-
 Estonia
-
 Eswatini
-
 Ethiopia
-
 Finland
-
 France
-
 Georgia
-
 Germany
-
 Ghana
Ghana
-
 Greece
-
 Haiti
Haiti
-
 Hong Kong
-
 Hungary
-
 India
India
-
 Indonesia
-
 Iran, Islamic republic
-
 Iraq
Iraq
-
 Ireland
-
 Israel
-
 Italy
Italy
-
 Jamaica
-
 Japan
Japan
-
 Jordan
-
 Kazakhstan
-
 Kenya
Kenya
-
 Korea
Korea
-
 Kuwait
-
 Kyrgyzstan
-
 Laos
Laos
-
 Latvia
-
 Lebanon
-
 Lesotho
-
 Libya
Libya
-
 Lithuania
-
 Luxembourg
-
 Madagascar
-
 Malaysia
-
 Malta
Malta
-
 Mauritius
-
 Mexico
-
 Moldova
-
 Mongolia
-
 Montenegro
-
 Morocco
-
 Mozambique
-
 Myanmar
-
 Namibia
-
 Nepal
Nepal
-
 Netherlands
-
 New Zealand
-
 Nigeria
-
 North Macedonia
-
 Norway
-
 Oman
Oman
-
 Pakistan
-
 Palestine
-
 Panama
-
 Papua New Guinea
-
 Paraguay
-
 Peru
Peru
-
 Philippines
-
 Poland
-
 Portugal
-
 Puerto Rico
-
 Qatar
Qatar
-
 Reunion
-
 Romania
-
 Rwanda
-
 Saudi Arabia
-
 Serbia
-
 Singapore
-
 Slovakia
-
 Slovenia
-
 Somalia
-
 South Africa
-
 Spain
Spain
-
 Sri Lanka
-
 Sweden
-
 Switzerland
-
 Syria
Syria
-
 Taiwan
-
 Tajikistan
-
 Tanzania
-
 Thailand
-
 Trinidad and Tobago
-
 Tunisia
-
 Turkey
-
 UAE
UAE
-
 Uganda
-
 Ukraine
-
 United Kingdom
-
United States
-
 Uruguay
-
 Uzbekistan
-
 Venezuela
-
 Vietnam
-
 Yemen
Yemen
-
 Zambia
-
 Zimbabwe
- Forex
- Crypto
