
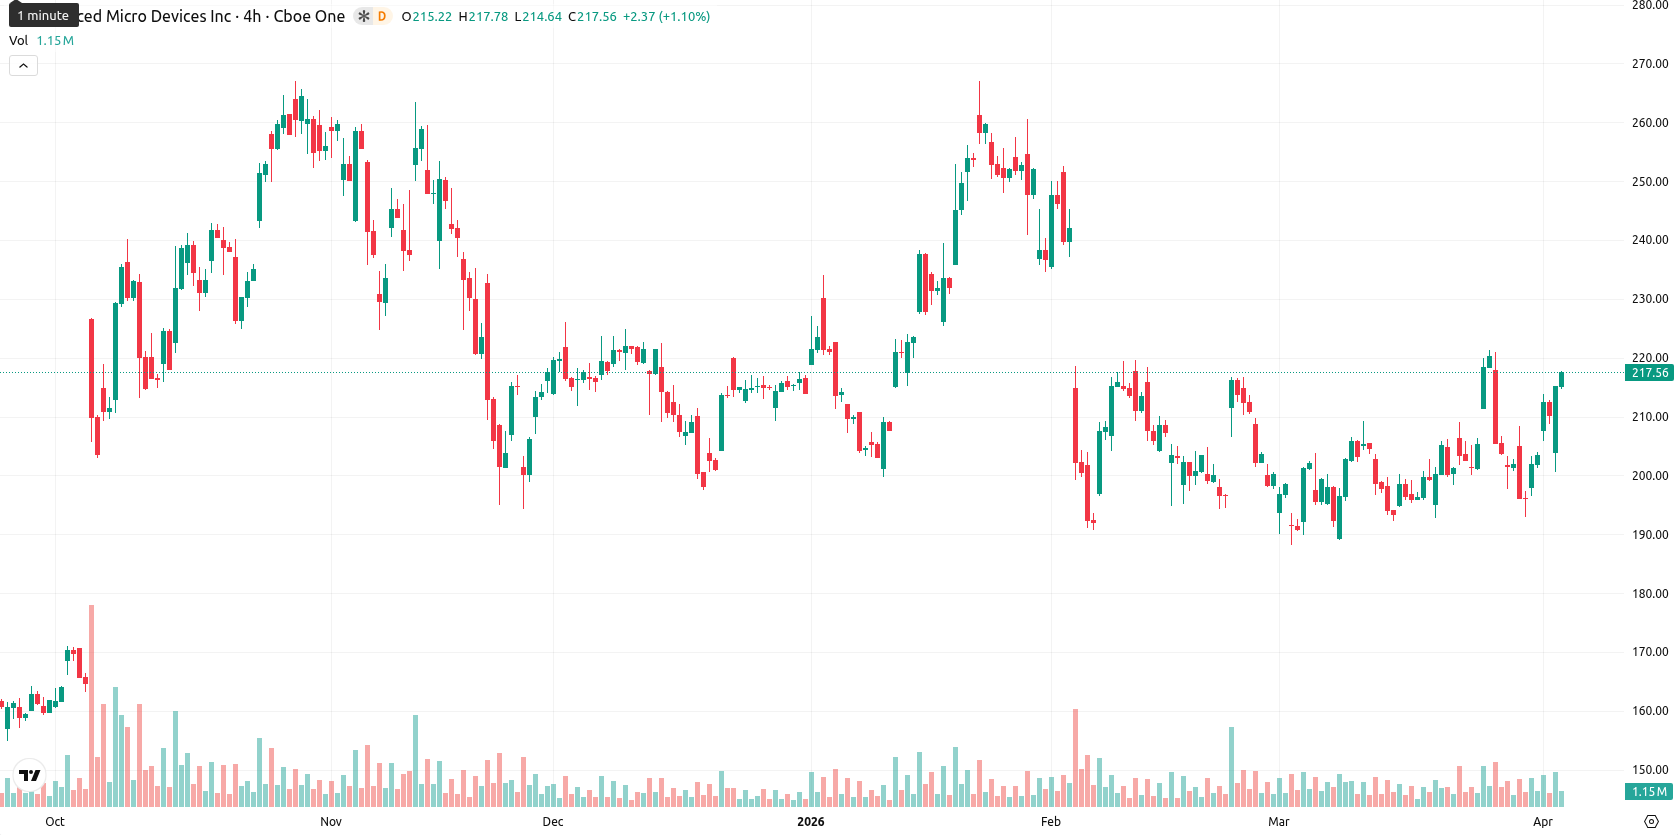
+3.48% for AMD stock as buyers drive price above short-term averages

Advanced Micro Devices, Inc. (AMD) is trading at $217.52, above the SMA-20 ($202.73), SMA-50 ($211.64), and SMA-200 ($196.88), reflecting clear upward momentum in the short, medium, and long term. The Ichimoku Kijun at $204.78 is below the current price, acting as immediate support.
Highlights
- AMD is exhibiting strong upward momentum, currently trading well above key moving averages across all timeframes.
- Technical indicators show persistent buying pressure and bullish momentum, but several overbought signals warn of elevated short-term risk.
- Expect AMD to consolidate in a $209–$225 range over the next week, with a high probability of continued gains unless support at $209 breaks.
Bullish momentum persists amid overbought signals and volatility
MACD and ADX indicate neutral but constructive momentum, while RSI (57.57) remains supportive of further gains. However, Stoch RSI, CCI, and BBP all flag overbought conditions, showing strong buyer dominance intraday. The Awesome Oscillator confirms current bullish momentum. AMD opened lower than yesterday’s close, creating a modest gap down, but reversed and climbed 3.48% on the day to finish near its session high in a wide trading range, signaling high volatility and strong upside pressure throughout the session. While momentum and persistent buying confirm the move, overbought oscillators highlight increasing risks of a short-term pause or pullback, creating some divergence across signals.
High upside probability as price seen consolidating within defined band
For the next 5 trading days, the price is expected to remain within a volatility band of $209 to $225 relative to current levels, reflecting typical fluctuations. There is a very high probability (more than 80%) of further increases, while a decline is considered less likely. The baseline scenario sees AMD consolidating between $209 and $225. A breakout above $225 could target renewed highs, while a drop below $209 might initiate a brief correction toward the Kijun support, but would not immediately disrupt the broader uptrend.
Earlier, analysts noted that AMD showed a bullish tilt with strong upward momentum but faced mixed short-term signals and the risk of near-term consolidation. The latest technical setup not only reaffirms this bullish bias but also highlights heightened volatility, making a confirmed breakout above $225 the primary level traders should watch for renewed upside momentum.


Latest AMD News


-
 Afghanistan
-
 Albania
-
 Algeria
-
 Angola
-
 Argentina
-
 Armenia
-
 Australia
-
 Austria
-
 Azerbaijan
-
 Bahamas
-
 Bahrain
-
 Bangladesh
-
 Belarus
-
 Belgium
-
 Bolivia
-
 Botswana
-
 Brazil
-
 Brunei
-
 Bulgaria
-
 Cambodia
-
 Cameroon
-
 Canada
-
 Chile
Chile
-
 China
China
-
 Colombia
-
 Congo
Congo
-
 Costa Rica
-
 Cote d'Ivoire
-
 Croatia
-
 Cuba
Cuba
-
 Cyprus
-
 Czechia
-
 DR Congo
-
 Denmark
-
 Dominican Republic
-
 Ecuador
-
 Egypt
Egypt
-
 El Salvador
-
 Estonia
-
 Eswatini
-
 Ethiopia
-
 Finland
-
 France
-
 Georgia
-
 Germany
-
 Ghana
Ghana
-
 Greece
-
 Haiti
Haiti
-
 Hong Kong
-
 Hungary
-
 India
India
-
 Indonesia
-
 Iran, Islamic republic
-
 Iraq
Iraq
-
 Ireland
-
 Israel
-
 Italy
Italy
-
 Jamaica
-
 Japan
Japan
-
 Jordan
-
 Kazakhstan
-
 Kenya
Kenya
-
 Korea
Korea
-
 Kuwait
-
 Kyrgyzstan
-
 Laos
Laos
-
 Latvia
-
 Lebanon
-
 Lesotho
-
 Libya
Libya
-
 Lithuania
-
 Luxembourg
-
 Madagascar
-
 Malaysia
-
 Malta
Malta
-
 Mauritius
-
 Mexico
-
 Moldova
-
 Mongolia
-
 Montenegro
-
 Morocco
-
 Mozambique
-
 Myanmar
-
 Namibia
-
 Nepal
Nepal
-
 Netherlands
-
 New Zealand
-
 Nigeria
-
 North Macedonia
-
 Norway
-
 Oman
Oman
-
 Pakistan
-
 Palestine
-
 Panama
-
 Papua New Guinea
-
 Paraguay
-
 Peru
Peru
-
 Philippines
-
 Poland
-
 Portugal
-
 Puerto Rico
-
 Qatar
Qatar
-
 Reunion
-
 Romania
-
 Rwanda
-
 Saudi Arabia
-
 Serbia
-
 Singapore
-
 Slovakia
-
 Slovenia
-
 Somalia
-
 South Africa
-
 Spain
Spain
-
 Sri Lanka
-
 Sweden
-
 Switzerland
-
 Syria
Syria
-
 Taiwan
-
 Tajikistan
-
 Tanzania
-
 Thailand
-
 Trinidad and Tobago
-
 Tunisia
-
 Turkey
-
 UAE
UAE
-
 Uganda
-
 Ukraine
-
 United Kingdom
-
United States
-
 Uruguay
-
 Uzbekistan
-
 Venezuela
-
 Vietnam
-
 Yemen
Yemen
-
 Zambia
-
 Zimbabwe
- Forex
- Crypto
