The tweet was deleted by the author.
But we saved everything 🙂.

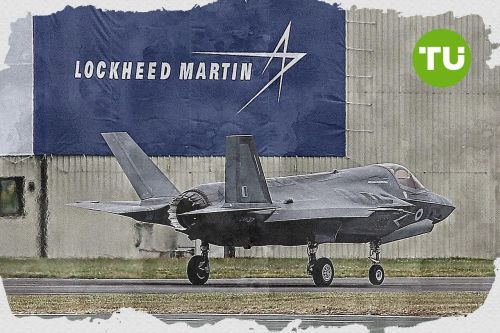
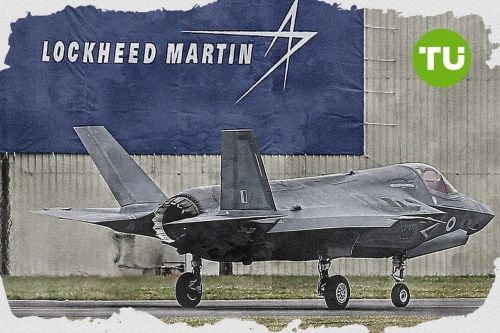
Lockheed Martin reported that the Orion spacecraft it built for NASA has completed its closest approach of the Moon.
The company said the crew delivered a view of Earth rarely seen. Lockheed Martin stated it is proud to support the Artemis program and the missions associated with it.
Lockheed Martin ($613.72) is currently trading below the MA-20 ($625.18) and MA-50 ($637.93), indicating sustained short- and medium-term downward pressure, while remaining well above the MA-200 ($517.26), which shows longer-term structural support. The Ichimoku Kijun on D1 is at $634.98, marking an immediate resistance level; near-term support sits at the MA-100 ($569.34), with key support at the MA-200 ($517.26) and resistance at the MA-20 and Ichimoku Kijun cluster, followed by key resistance at the MA-50.
Momentum indicators on D1 paint a weak picture: MACD signals a strong sell and ADX indicates trend indecision, pointing to a lack of directional conviction. The RSI and CCI both suggest mild oversold conditions, with BBP confirming dominant seller pressure throughout the session. Stoch RSI is neutral on D1 but shows oversold readings on several lower timeframes, highlighting mixed short-term sentiment. In today's session, Lockheed Martin dropped 1.63%, accelerating this week's decline. The price is trading at $613.72, down from $622.79 a week ago, reflecting a 1.46% decline, now positioned in the lower part of the weekly range while weekly volatility stands at 5.35%. Persistent selling from the previous high suggests a steady pullback rather than a sharp capitulation.
For the upcoming week, Lockheed Martin is expected to trade in a range between $600 and $626, which keeps the price anchored well above the 52-week low of $410.11 but below the recent 52-week high of $692.00. The probability of a price increase is very low (less than 20%) based on W1 momentum (only MACD on W1 is bullish, while D1 signals are strongly bearish); a further decline is therefore much more likely. Baseline scenario: the stock stays rangebound as oversold conditions limit downside momentum near recent lows. Bullish scenario: a break above $625–$635 resistance could trigger short covering and a move toward $637.93. Bearish scenario: a fall below $600 would open the way to test $569 support, with further downside if selling pressure intensifies.
Previously it was reported that Lockheed Martin faced near-term bearish pressure, but multi-week technical indicators suggested a potential rebound if key support levels held. In the current context, investors should remain alert to fresh momentum shifts that may determine whether the prevailing consolidation gives way to a renewed trend.

 Afghanistan
 Albania
 Algeria
 Angola
 Argentina
 Armenia
 Australia
 Austria
 Azerbaijan
 Bahamas
 Bahrain
 Bangladesh
 Belarus
 Belgium
 Bolivia
 Botswana
 Brazil
 Brunei
 Bulgaria
 Cambodia
 Cameroon
 Canada
 Chile
Chile
 China
China
 Colombia
 Congo
Congo
 Costa Rica
 Cote d'Ivoire
 Croatia
 Cuba
Cuba
 Cyprus
 Czechia
 DR Congo
 Denmark
 Dominican Republic
 Ecuador
 Egypt
Egypt
 El Salvador
 Estonia
 Eswatini
 Ethiopia
 Finland
 France
 Georgia
 Germany
 Ghana
Ghana
 Greece
 Haiti
Haiti
 Hong Kong
 Hungary
 India
India
 Indonesia
 Iran, Islamic republic
 Iraq
Iraq
 Ireland
 Israel
 Italy
Italy
 Jamaica
 Japan
Japan
 Jordan
 Kazakhstan
 Kenya
Kenya
 Korea
Korea
 Kuwait
 Kyrgyzstan
 Laos
Laos
 Latvia
 Lebanon
 Lesotho
 Libya
Libya
 Lithuania
 Luxembourg
 Madagascar
 Malaysia
 Malta
Malta
 Mauritius
 Mexico
 Moldova
 Mongolia
 Montenegro
 Morocco
 Mozambique
 Myanmar
 Namibia
 Nepal
Nepal
 Netherlands
 New Zealand
 Nigeria
 North Macedonia
 Norway
 Oman
Oman
 Pakistan
 Palestine
 Panama
 Papua New Guinea
 Paraguay
 Peru
Peru
 Philippines
 Poland
 Portugal
 Puerto Rico
 Qatar
Qatar
 Reunion
 Romania
 Rwanda
 Saudi Arabia
 Serbia
 Singapore
 Slovakia
 Slovenia
 Somalia
 South Africa
 Spain
Spain
 Sri Lanka
 Sweden
 Switzerland
 Syria
Syria
 Taiwan
 Tajikistan
 Tanzania
 Thailand
 Trinidad and Tobago
 Tunisia
 Turkey
 UAE
UAE
 Uganda
 Ukraine
 United Kingdom
United States
United Kingdom
United States
 Uruguay
 Uzbekistan
 Venezuela
 Vietnam
 Yemen
Yemen
 Zambia
 Zimbabwe