
The Trade Desk stock drops with sellers holding control of the short-term trend

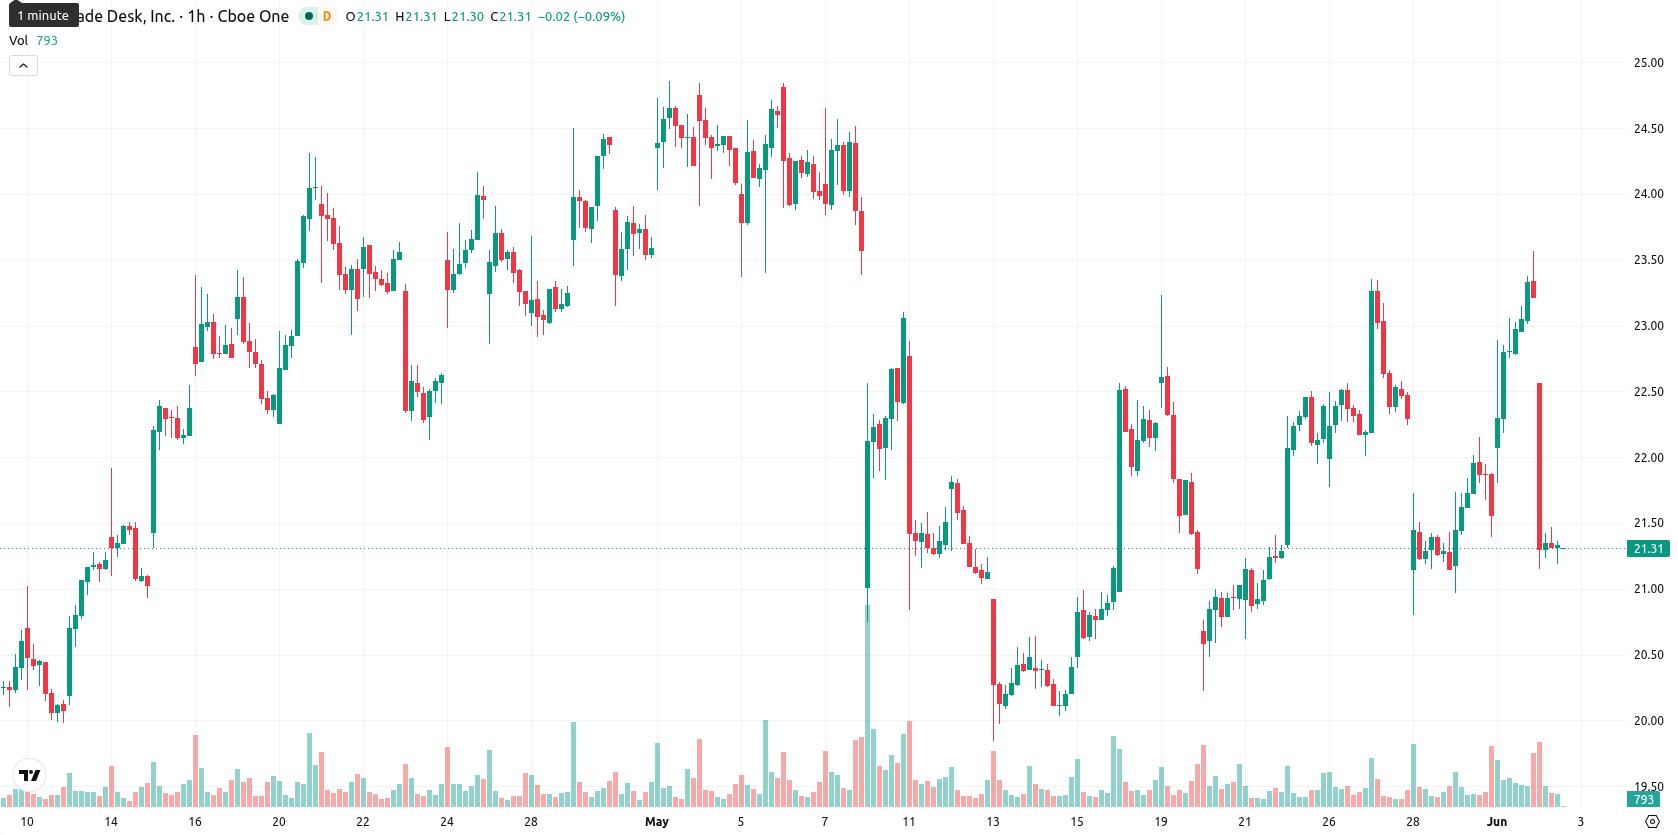
The Trade Desk (TTD) stock is trading at $21.31, marking a daily decline of 8.25%. The price is currently positioned below its key moving averages, highlighting prevailing short- and medium-term weakness.
Highlights
- The Trade Desk exhibits strong GARP credentials, featuring 21% five-year EPS growth and a PEG ratio of 0.63.
- The firm's debt-free balance sheet and notable profitability indicate effective financial stewardship amid ongoing share price pressure.
- Technically, the stock trades below key moving averages with bearish momentum, while the five-day forecast targets a $20.20–$22.40 range and limited upside probability.
Long-term GARP profile offset as broader selling pressure persists
Recent analysis reported that The Trade Desk meets several growth at a reasonable price (GARP) benchmarks, including a five-year earnings per share growth rate of 21% and a price/earnings-to-growth ratio of 0.63. The company was also noted to have no debt and to demonstrate robust profitability, reflecting disciplined financial management. Together, these metrics suggest the stock has maintained an attractive long-term growth profile, though price action has remained under broader selling pressure.
Mixed momentum signals amid resistance and elevated volatility
TTD is trading below the SMA-20 at $22.12, SMA-50 at $22.33, and SMA-200 at $35.90, while the Ichimoku Kijun level at $22.34 acts as immediate resistance. The MACD currently signals strong bearish momentum, and the ADX reading of 11.67 suggests trend strength remains weak and indecisive. Meanwhile, daily RSI at 55.21 and CCI at 52.52 provide mild buy indications, but both Stoch RSI and Bull/Bear Power (BBP) point to overbought conditions, highlighting short-term exhaustion among buyers. The Awesome Oscillator remains neutral, underscoring a divergence between various momentum and oscillator signals. Volatility is elevated following a gap lower at the open and a sharp intraday move, with trading centered near the day's low and sustained downward pressure prevailing after the opening bell.
Sideways action expected as breakout risk remains limited
Looking ahead, the expected price range for TTD over the next five trading days is adjusted to $20.20 to $22.40, reflecting typical volatility bands around current levels. The probability of an upward move is low (less than 20%), as major weekly indicators do not support a bullish reversal. The baseline expectation is for sideways price action within this band. A breakout above immediate resistance at $22.34 could open a path toward the upper end of the range, while a drop below $20.20 would likely accelerate declines toward subsequent support areas amid ongoing weak momentum.
Earlier, analysts noted that The Trade Desk was experiencing mixed technical signals, with short-term momentum countered by broader bearish trends. With today’s decisive breakdown below key moving averages and persistent indicator divergence, traders should closely monitor the $20.20 support level for potential downside acceleration if weakness continues.


Latest The Trade Desk News


-
 Afghanistan
-
 Albania
-
 Algeria
-
 Angola
-
 Argentina
-
 Armenia
-
 Australia
-
 Austria
-
 Azerbaijan
-
 Bahamas
-
 Bahrain
-
 Bangladesh
-
 Belarus
-
 Belgium
-
 Bolivia
-
 Botswana
-
 Brazil
-
 Brunei
-
 Bulgaria
-
 Cambodia
-
 Cameroon
-
 Canada
-
 Chile
Chile
-
 China
China
-
 Colombia
-
 Congo
Congo
-
 Costa Rica
-
 Cote d'Ivoire
-
 Croatia
-
 Cuba
Cuba
-
 Cyprus
-
 Czechia
-
 DR Congo
-
 Denmark
-
 Dominican Republic
-
 Ecuador
-
 Egypt
Egypt
-
 El Salvador
-
 Estonia
-
 Eswatini
-
 Ethiopia
-
 Finland
-
 France
-
 Georgia
-
 Germany
-
 Ghana
Ghana
-
 Greece
-
 Haiti
Haiti
-
 Hong Kong
-
 Hungary
-
 India
India
-
 Indonesia
-
 Iran, Islamic republic
-
 Iraq
Iraq
-
 Ireland
-
 Israel
-
 Italy
Italy
-
 Jamaica
-
 Japan
Japan
-
 Jordan
-
 Kazakhstan
-
 Kenya
Kenya
-
 Korea
Korea
-
 Kuwait
-
 Kyrgyzstan
-
 Laos
Laos
-
 Latvia
-
 Lebanon
-
 Lesotho
-
 Libya
Libya
-
 Lithuania
-
 Luxembourg
-
 Madagascar
-
 Malaysia
-
 Malta
Malta
-
 Mauritius
-
 Mexico
-
 Moldova
-
 Mongolia
-
 Montenegro
-
 Morocco
-
 Mozambique
-
 Myanmar
-
 Namibia
-
 Nepal
Nepal
-
 Netherlands
-
 New Zealand
-
 Nigeria
-
 North Macedonia
-
 Norway
-
 Oman
Oman
-
 Pakistan
-
 Palestine
-
 Panama
-
 Papua New Guinea
-
 Paraguay
-
 Peru
Peru
-
 Philippines
-
 Poland
-
 Portugal
-
 Puerto Rico
-
 Qatar
Qatar
-
 Reunion
-
 Romania
-
 Rwanda
-
 Saudi Arabia
-
 Serbia
-
 Singapore
-
 Slovakia
-
 Slovenia
-
 Somalia
-
 South Africa
-
 Spain
Spain
-
 Sri Lanka
-
 Sweden
-
 Switzerland
-
 Syria
Syria
-
 Taiwan
-
 Tajikistan
-
 Tanzania
-
 Thailand
-
 Trinidad and Tobago
-
 Tunisia
-
 Turkey
-
 UAE
UAE
-
 Uganda
-
 Ukraine
-
 United Kingdom
-
United States
-
 Uruguay
-
 Uzbekistan
-
 Venezuela
-
 Vietnam
-
 Yemen
Yemen
-
 Zambia
-
 Zimbabwe
- Forex
- Crypto
