
AMD stock price forecast: $450.41 support in focus as AMD trades flat

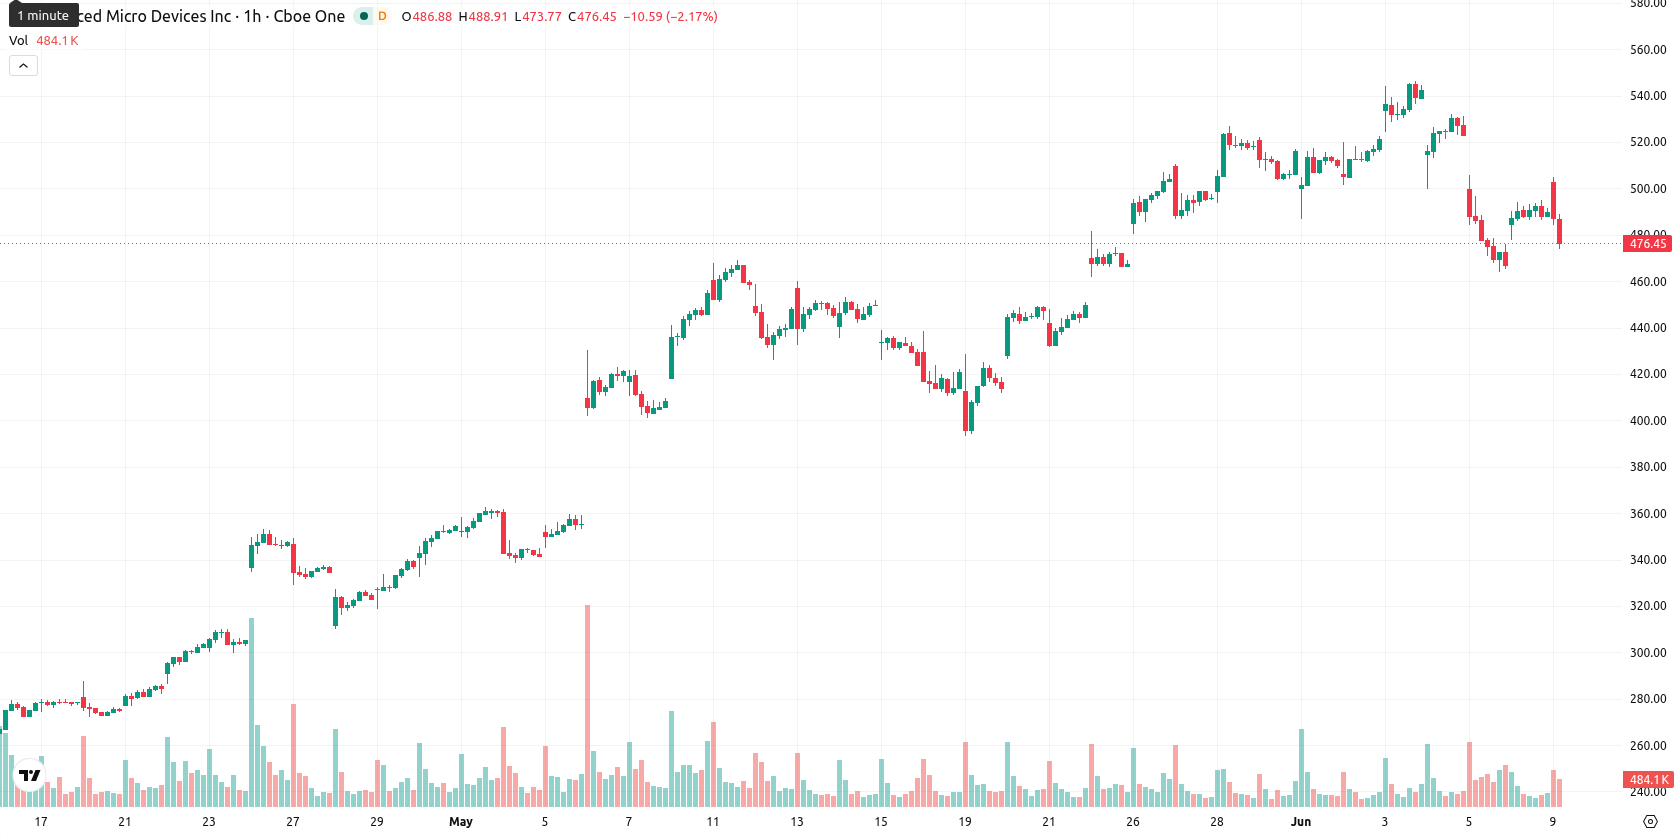
Advanced Micro Devices, Inc. (AMD) stock is trading at $487.87, down 0.76% on the day. The price currently sits below its key moving averages, reflecting short-term weakness compared to recent levels.
Highlights
- AMD faces persistent selling pressure, trading below key short- and medium-term technical moving averages in recent sessions.
- Momentum indicators present mixed signals, with bearish bias dominant while some short-term readings indicate overbought conditions.
- Over the next few days, AMD is likely to move sideways within a $450.41 to $525.33 range, with a 71% probability of downside.
Conflicted intraday momentum as technical boundaries tighten
On the technical front, AMD trades below the SMA-20 ($490.97) and SMA-50 ($507.61) on the H1 chart, while remaining well above the long-term SMA-200 ($247.58). The immediate resistance is defined by the Ichimoku Kijun level at $505.21. Intraday momentum remains weak: MACD signals a strong sell, ADX is neutral, and RSI sits at 46.96, indicating a mild sell bias. Stoch RSI and BBP both show overbought conditions, and CCI reads neutral. BBP’s overbought signal shows buyer dominance in the very short term, though overall momentum is conflicted.
Downside risk dominates as volatility drives range-bound outlook
Looking ahead, AMD is expected to be range-bound between $450.41 and $525.33 over the coming days, with a 29% probability for an upward move versus 71% for a downward move. The baseline scenario is for price to continue sideways within this volatility band. An upside break through $505.21 could trigger further gains, while a drop below $450.41 would indicate sellers regaining control.
Earlier, analysts noted that AMD sustained a broadly bullish technical outlook driven by strong buying momentum and favorable long-term trends. However, the latest shift in short-term momentum highlights increased downside risk, making the $450.41 level critical to monitor as a potential trigger for further weakness.


Latest AMD News


-
 Afghanistan
-
 Albania
-
 Algeria
-
 Angola
-
 Argentina
-
 Armenia
-
 Australia
-
 Austria
-
 Azerbaijan
-
 Bahamas
-
 Bahrain
-
 Bangladesh
-
 Belarus
-
 Belgium
-
 Bolivia
-
 Botswana
-
 Brazil
-
 Brunei
-
 Bulgaria
-
 Cambodia
-
 Cameroon
-
 Canada
-
 Chile
Chile
-
 China
China
-
 Colombia
-
 Congo
Congo
-
 Costa Rica
-
 Cote d'Ivoire
-
 Croatia
-
 Cuba
Cuba
-
 Cyprus
-
 Czechia
-
 DR Congo
-
 Denmark
-
 Dominican Republic
-
 Ecuador
-
 Egypt
Egypt
-
 El Salvador
-
 Estonia
-
 Eswatini
-
 Ethiopia
-
 Finland
-
 France
-
 Georgia
-
 Germany
-
 Ghana
Ghana
-
 Greece
-
 Haiti
Haiti
-
 Hong Kong
-
 Hungary
-
 India
India
-
 Indonesia
-
 Iran, Islamic republic
-
 Iraq
Iraq
-
 Ireland
-
 Israel
-
 Italy
Italy
-
 Jamaica
-
 Japan
Japan
-
 Jordan
-
 Kazakhstan
-
 Kenya
Kenya
-
 Korea
Korea
-
 Kuwait
-
 Kyrgyzstan
-
 Laos
Laos
-
 Latvia
-
 Lebanon
-
 Lesotho
-
 Libya
Libya
-
 Lithuania
-
 Luxembourg
-
 Madagascar
-
 Malaysia
-
 Malta
Malta
-
 Mauritius
-
 Mexico
-
 Moldova
-
 Mongolia
-
 Montenegro
-
 Morocco
-
 Mozambique
-
 Myanmar
-
 Namibia
-
 Nepal
Nepal
-
 Netherlands
-
 New Zealand
-
 Nigeria
-
 North Macedonia
-
 Norway
-
 Oman
Oman
-
 Pakistan
-
 Palestine
-
 Panama
-
 Papua New Guinea
-
 Paraguay
-
 Peru
Peru
-
 Philippines
-
 Poland
-
 Portugal
-
 Puerto Rico
-
 Qatar
Qatar
-
 Reunion
-
 Romania
-
 Rwanda
-
 Saudi Arabia
-
 Serbia
-
 Singapore
-
 Slovakia
-
 Slovenia
-
 Somalia
-
 South Africa
-
 Spain
Spain
-
 Sri Lanka
-
 Sweden
-
 Switzerland
-
 Syria
Syria
-
 Taiwan
-
 Tajikistan
-
 Tanzania
-
 Thailand
-
 Trinidad and Tobago
-
 Tunisia
-
 Turkey
-
 UAE
UAE
-
 Uganda
-
 Ukraine
-
 United Kingdom
-
United States
-
 Uruguay
-
 Uzbekistan
-
 Venezuela
-
 Vietnam
-
 Yemen
Yemen
-
 Zambia
-
 Zimbabwe
- Forex
- Crypto
