


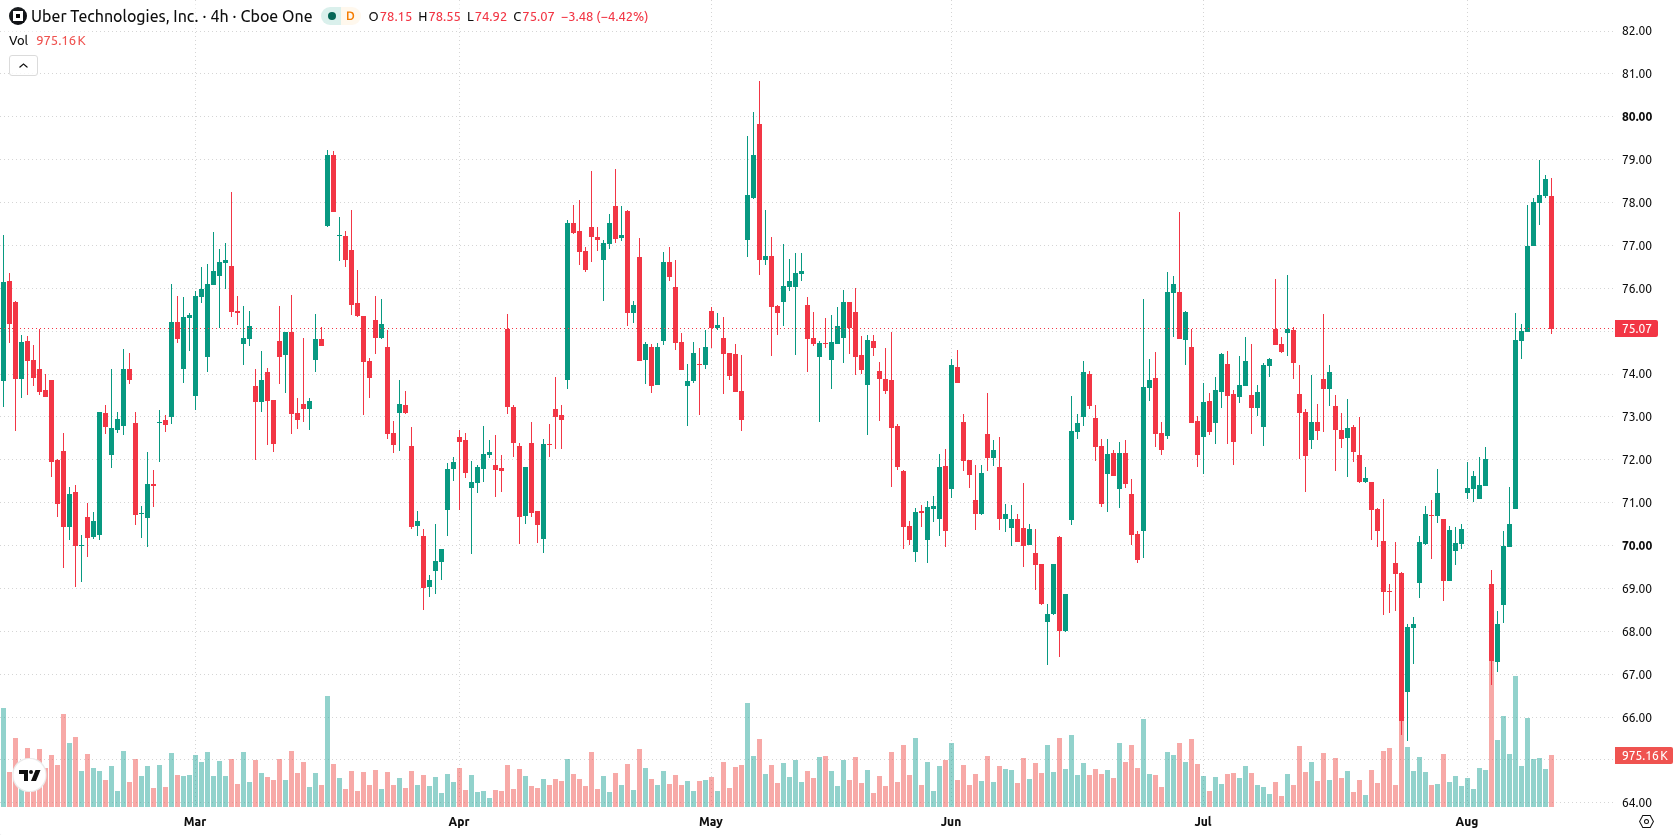
Uber Technologies, Inc. (UBER) fell 4.39% after a downside gap, as intraday selling pressure intensified even as the company recently reported strong gross bookings and highlighted significant free cash flow generation and buybacks. The pullback is reinforced by overbought technical signals and sustained long-term resistance near the major moving averages.
 65.66
66.82
Highlights
- Uber reported $58 billion in gross bookings and generated $10 billion in free cash flow over the last twelve months.
- The company conducted $3.5 billion in share buybacks this year and plans to return about 50% of free cash flow to shareholders.
- Shares of Uber declined 4.39% to $75.09 with technical indicators mixed and the near-term trading range expected between $69.68 and $80.5.
Shareholder returns rise as buybacks and new initiatives expand
Uber reported gross bookings of $58 billion in its latest earnings release and highlighted approximately $10 billion in free cash flow generated over the past twelve months. The company has executed around $3.5 billion in stock buybacks this year, with a framework to return about 50% of free cash flow to shareholders through further repurchases. Uber scaled its autonomous vehicle operations to additional cities, completed the sale of its stake in Serve Robotics, and expanded its service coverage in India, though price action has remained under broader selling pressure.
Mixed technical signals emerge as momentum wanes and resistance holds
Uber is trading above its 20-day and 50-day moving averages ($71.64 and $72.05), suggesting sustained short- and medium-term upward momentum, but remains below the 200-day moving average ($77.88), which signals ongoing long-term overhead resistance. The closest support is identified at $74.96, with resistance at $77.88. The Ichimoku Kijun at $72.19 currently acts as support. MACD and ADX point to a neutral trend. The Relative Strength Index (RSI) at 63.89 signals a buying bias, yet Stochastic RSI, Commodity Channel Index (CCI), and Bull/Bear Power (BBP) indicate overbought conditions. BBP at 5.88 confirms buyers dominate intraday momentum, and the Awesome Oscillator (AO) gives a strong buy signal. However, Uber declined to $75.09 after a downside gap near the open and is trading near the session low, with intraday volatility at 4.47%. There is clear downside pressure after the open, and overbought signals now conflict with the earlier strong upside trend.
Earlier, analysts noted that Uber's rally was supported by strong operating momentum but tempered by technical overbought signals and persistent long-term resistance. The latest pullback, paired with ongoing overbought readings and increased selling pressure, adds to downside risk in the short term, making price action around the $77.88 resistance critical for determining the next directional move.









-
 Afghanistan
-
 Albania
-
 Algeria
-
 Angola
-
 Argentina
-
 Armenia
-
 Australia
-
 Austria
-
 Azerbaijan
-
 Bahamas
-
 Bahrain
-
 Bangladesh
-
 Belarus
-
 Belgium
-
 Bolivia
-
 Botswana
-
 Brazil
-
 Brunei
-
 Bulgaria
-
 Cambodia
-
 Cameroon
-
 Canada
-
 Chile
-
 China
-
 Colombia
-
 Congo
-
 Costa Rica
-
 Cote d'Ivoire
-
 Croatia
-
 Cuba
-
 Cyprus
-
 Czechia
-
 DR Congo
-
 Denmark
-
 Dominican Republic
-
 Ecuador
-
 Egypt
-
 El Salvador
-
 Estonia
-
 Eswatini
-
 Ethiopia
-
 Finland
-
 France
-
 Georgia
-
 Germany
-
 Ghana
-
 Greece
-
 Haiti
-
 Hong Kong
-
 Hungary
-
 India
-
 Indonesia
-
 Iran, Islamic republic
-
 Iraq
-
 Ireland
-
 Israel
-
 Italy
-
 Jamaica
-
 Japan
-
 Jordan
-
 Kazakhstan
-
 Kenya
-
 Korea
-
 Kuwait
-
 Kyrgyzstan
-
 Laos
-
 Latvia
-
 Lebanon
-
 Lesotho
-
 Libya
-
 Lithuania
-
 Luxembourg
-
 Madagascar
-
 Malaysia
-
 Malta
-
 Mauritius
-
 Mexico
-
 Moldova
-
 Mongolia
-
 Montenegro
-
 Morocco
-
 Mozambique
-
 Myanmar
-
 Namibia
-
 Nepal
-
 Netherlands
-
 New Zealand
-
 Nigeria
-
 North Macedonia
-
 Norway
-
 Oman
-
 Pakistan
-
 Palestine
-
 Panama
-
 Papua New Guinea
-
 Paraguay
-
 Peru
-
 Philippines
-
 Poland
-
 Portugal
-
 Puerto Rico
-
 Qatar
-
 Reunion
-
 Romania
-
 Rwanda
-
 Saudi Arabia
-
 Serbia
-
 Singapore
-
 Slovakia
-
 Slovenia
-
 Somalia
-
 South Africa
-
 Spain
-
 Sri Lanka
-
 Sweden
-
 Switzerland
-
 Syria
-
 Taiwan
-
 Tajikistan
-
 Tanzania
-
 Thailand
-
 Trinidad and Tobago
-
 Tunisia
-
 Turkey
-
 UAE
-
 Uganda
-
 Ukraine
-
 United Kingdom
-
United States
-
 Uruguay
-
 Uzbekistan
-
 Venezuela
-
 Vietnam
-
 Yemen
-
 Zambia
-
 Zimbabwe
- Forex
- Crypto












