
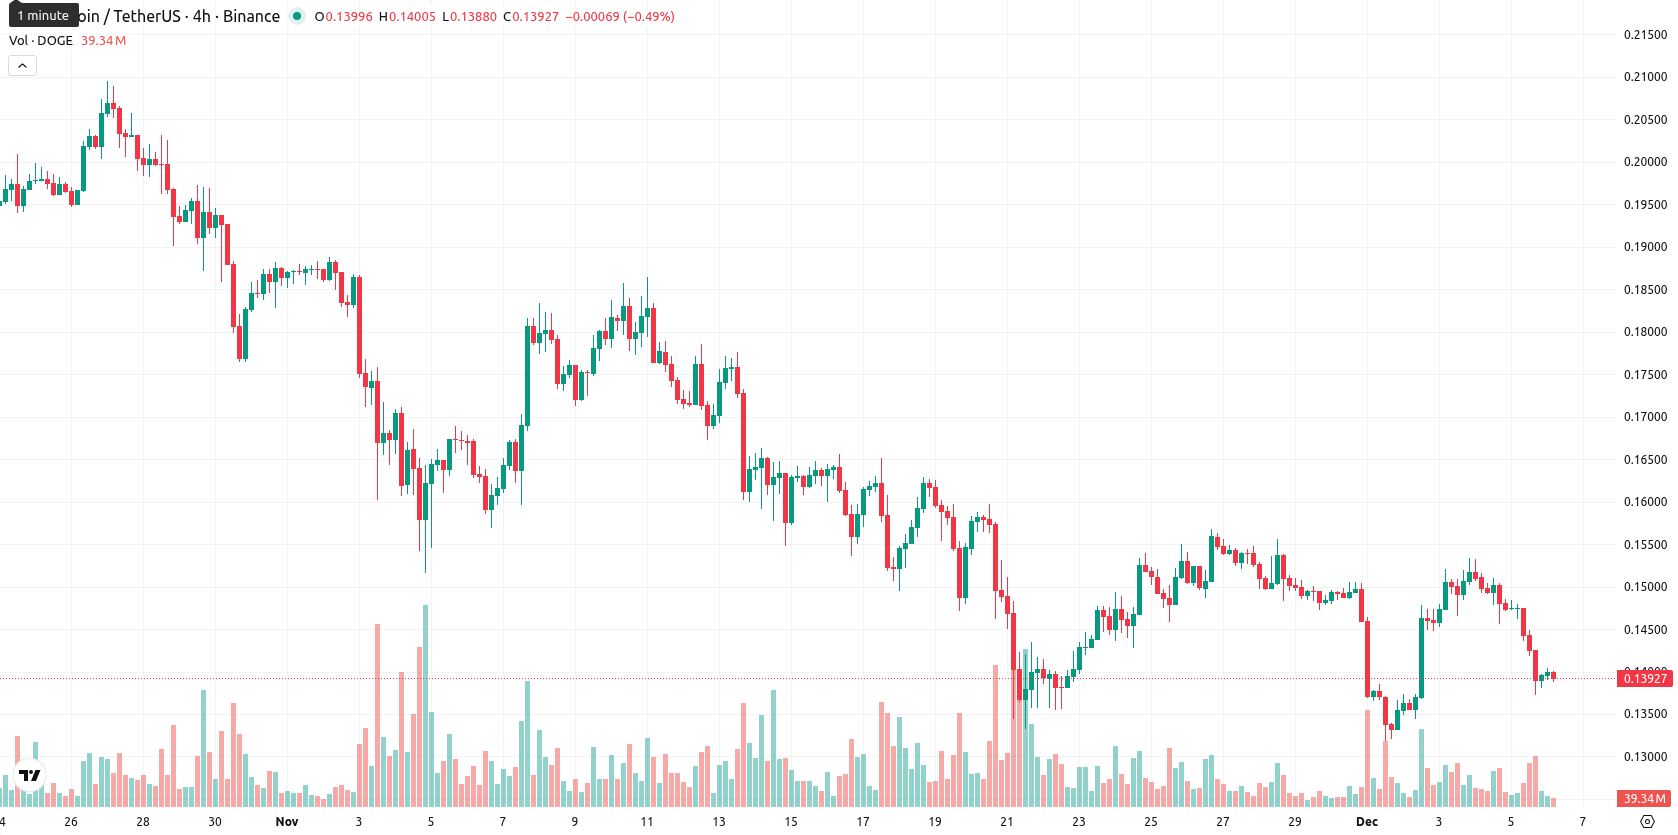
Dogecoin price prediction: More declines ahead? DOGE faces pressure near $0.139

Dogecoin (DOGE) is currently trading at $0.1393, which is below the MA-20 ($0.14889), MA-50 ($0.16914), and MA-200 ($0.20370), signaling ongoing short-, medium-, and long-term downside pressure. The nearest Ichimoku Kijun level at $0.15909 acts as dynamic resistance, reinforcing bearish sentiment with no signs of a reversal.
Highlights
- Dogecoin's network activity increased, with daily active addresses up and Buenos Aires accepting Dogecoin for municipal tax and fee payments.
- The Dogecoin team marked an adoption milestone, indicating a notable rise in real-world use cases for the cryptocurrency.
- Speculative interest and trading volumes in Dogecoin have grown, maintaining its position as a leading meme cryptocurrency by market capitalization.
Real-world adoption expands as volumes and speculation accelerate
Dogecoin's network has seen a notable increase in daily active addresses and use cases, including Buenos Aires now accepting Dogecoin for municipal tax and fee payments. The team recently celebrated an adoption milestone, reflecting growing real-world usage of the asset. In addition, speculative interest and trading volumes have risen while Dogecoin remains a leading meme cryptocurrency by market capitalization.
Oversold signals emerge as bearish momentum and gap down persist
Momentum indicators confirm strong downward pressure, as the daily MACD remains firmly in "strong sell" territory and ADX also signals a bearish trend. RSI (38.9), Stochastic RSI, and CCI all point to oversold conditions, indicating short-term exhaustion but no clear sign of reversal, while BBP suggests sellers dominate intraday trading. The price opened lower than the previous close (from $0.14687 to $0.13942, showing a gap down) and is currently near the day’s low, reflecting persistent intraday weakness on moderate volatility. The daily loss of 5.15% and dominance of sellers after the open align with the overall momentum, while the Awesome Oscillator remains neutral and thus does not contradict this bearish setup.
Downside consolidation likely as volatility and bearish bias persist
For the next five trading days, DOGE is expected to fluctuate within a typical volatility band of $0.125 to $0.145. The probability of a further price decline is very high (more than 80%), while a recovery is much less likely, based on all major D1 and W1 indicators remaining bearish. The baseline scenario is for DOGE to consolidate in a sideways-to-lower range amid ongoing pressure. In a bullish scenario, a break above $0.145 could open the way to test resistance at $0.159, while a bearish move below $0.135 could expose the asset to short-term lows, though oversold signals may trigger a brief pause or bounce.
Previously it was reported that Dogecoin remained in a multi-week downtrend, with price compressed into a narrow range below descending 20- and 50-day EMAs and testing long-term support, as momentum indicators such as RSI stayed weak and no bullish divergences emerged. A lack of structural inflows and repeated rejection by resistance maintained the prevailing downside pressure, while the market awaited clear direction near key demand zones, as rallies repeatedly fail near the descending trendline.


Latest DOGE News


-
 Afghanistan
-
 Albania
-
 Algeria
-
 Angola
-
 Argentina
-
 Armenia
-
 Australia
-
 Austria
-
 Azerbaijan
-
 Bahamas
-
 Bahrain
-
 Bangladesh
-
 Belarus
-
 Belgium
-
 Bolivia
-
 Botswana
-
 Brazil
-
 Brunei
-
 Bulgaria
-
 Cambodia
-
 Cameroon
-
 Canada
-
 Chile
Chile
-
 China
China
-
 Colombia
-
 Congo
Congo
-
 Costa Rica
-
 Cote d'Ivoire
-
 Croatia
-
 Cuba
Cuba
-
 Cyprus
-
 Czechia
-
 DR Congo
-
 Denmark
-
 Dominican Republic
-
 Ecuador
-
 Egypt
Egypt
-
 El Salvador
-
 Estonia
-
 Eswatini
-
 Ethiopia
-
 Finland
-
 France
-
 Georgia
-
 Germany
-
 Ghana
Ghana
-
 Greece
-
 Haiti
Haiti
-
 Hong Kong
-
 Hungary
-
 India
India
-
 Indonesia
-
 Iran, Islamic republic
-
 Iraq
Iraq
-
 Ireland
-
 Israel
-
 Italy
Italy
-
 Jamaica
-
 Japan
Japan
-
 Jordan
-
 Kazakhstan
-
 Kenya
Kenya
-
 Korea
Korea
-
 Kuwait
-
 Kyrgyzstan
-
 Laos
Laos
-
 Latvia
-
 Lebanon
-
 Lesotho
-
 Libya
Libya
-
 Lithuania
-
 Luxembourg
-
 Madagascar
-
 Malaysia
-
 Malta
Malta
-
 Mauritius
-
 Mexico
-
 Moldova
-
 Mongolia
-
 Montenegro
-
 Morocco
-
 Mozambique
-
 Myanmar
-
 Namibia
-
 Nepal
Nepal
-
 Netherlands
-
 New Zealand
-
 Nigeria
-
 North Macedonia
-
 Norway
-
 Oman
Oman
-
 Pakistan
-
 Palestine
-
 Panama
-
 Papua New Guinea
-
 Paraguay
-
 Peru
Peru
-
 Philippines
-
 Poland
-
 Portugal
-
 Puerto Rico
-
 Qatar
Qatar
-
 Reunion
-
 Romania
-
 Rwanda
-
 Saudi Arabia
-
 Serbia
-
 Singapore
-
 Slovakia
-
 Slovenia
-
 Somalia
-
 South Africa
-
 Spain
Spain
-
 Sri Lanka
-
 Sweden
-
 Switzerland
-
 Syria
Syria
-
 Taiwan
-
 Tajikistan
-
 Tanzania
-
 Thailand
-
 Trinidad and Tobago
-
 Tunisia
-
 Turkey
-
 UAE
UAE
-
 Uganda
-
 Ukraine
-
 United Kingdom
-
United States
-
 Uruguay
-
 Uzbekistan
-
 Venezuela
-
 Vietnam
-
 Yemen
Yemen
-
 Zambia
-
 Zimbabwe
- Forex
- Crypto
