
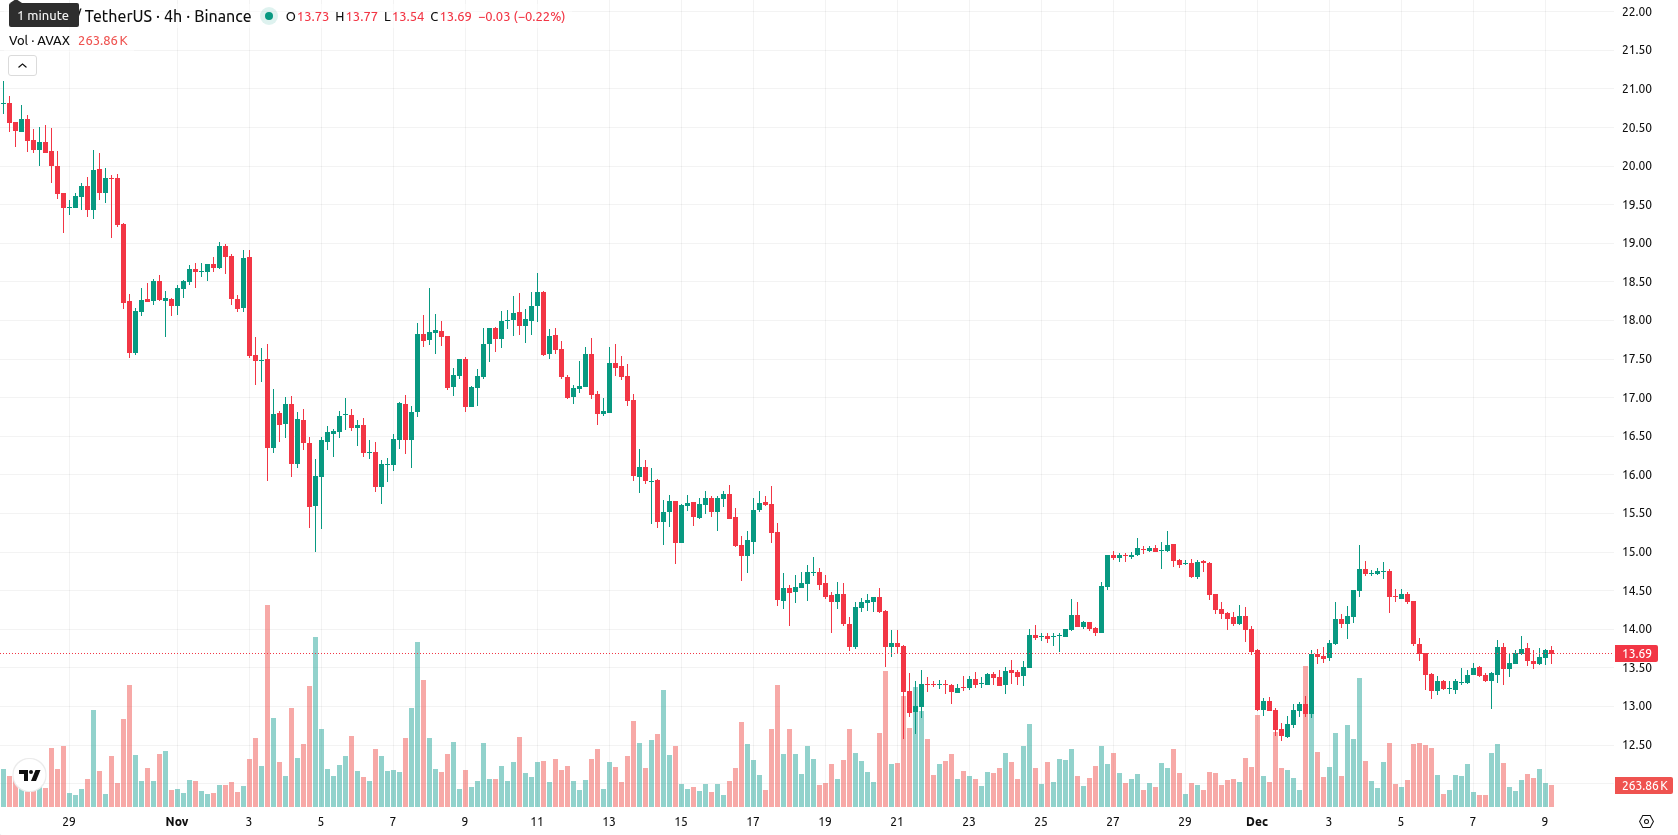
Avalanche price prediction: More downside ahead? AVAX consolidates near $13.62

Avalanche (AVAX) is trading at $13.62, which is below its MA-20 at $13.90, MA-50 at $16.22, and MA-200 at $21.79, indicating persistent selling pressure across short-, medium-, and long-term horizons. The daily decline of 0.37% came with no significant gap at the open, placing the price in the mid-to-lower part of today’s range and signaling moderate intraday volatility and sustained pressure after the bell.
Highlights
- Avalanche reported net outflows of approximately $343,480 on December 8, reflecting continued distribution and compression in market capitalization.
- Despite a total value locked of $1.8 billion and around 2 million daily transactions, growth in key ecosystem subnets has slowed.
- Liquidity remains thin, intensifying volatility and short-term weakness for Avalanche amid ongoing subdued activity and market outflows.
Ongoing capital outflows and slowed network activity drive volatility
Avalanche has reported continued net outflows, with Coinglass showing a withdrawal of around $343,480 on December 8, highlighting ongoing distribution and compression in market capitalization. The platform retains a total value locked of approximately $1.8 billion and processes about 2 million daily transactions, yet activity growth in key ecosystem subnets has slowed and liquidity remains thin, contributing to heightened volatility and short-term weakness.
Contrasting oscillators as strong bearish momentum meets oversold signals
Momentum indicators remain decisively bearish, with the MACD signaling a strong sell and the ADX at 42.69 confirming a strong downward trend. Both RSI and CCI are in sell or neutral territory, while Stochastic RSI and BBP highlight a near-oversold environment but still show seller dominance intraday. The Awesome Oscillator is neutral and does not support any reversal. There is notable divergence among oscillators, with some brief oversold signals clashing against strong bearish momentum, suggesting any relief bounces may remain short-lived unless momentum reverses. Nearest dynamic support is not specified below, while the Ichimoku Kijun resistance stands at $15.12, placing the price well below this key level.
Limited rebound prospects as sideways trading and downside risk persist
Over the next five trading days, AVAX is expected to trade within a typical volatility band between $13.17 and $13.30, reflecting a tight sideways corridor near current levels. The probability of a meaningful price increase is very low (less than 20%), making further declines the more likely scenario. A bullish scenario would require a breakout above the $15.12 resistance, targeting recovery toward $16.22, while a move below $13.17 may trigger additional downside risk toward the $13.00 area.
Last time, analysts noted Avalanche was trading below major moving averages, with a modest intraday recovery failing to reclaim the EMA cluster and technical indicators showing continued trend weakness. The RSI rebounded from oversold conditions but did not signal breakout strength, as maintaining levels above $13.20 supports ongoing stabilization, while resistance remains at the broader trend weakness persists despite today’s bounce zone.


Latest Avalanche News


-
 Afghanistan
-
 Albania
-
 Algeria
-
 Angola
-
 Argentina
-
 Armenia
-
 Australia
-
 Austria
-
 Azerbaijan
-
 Bahamas
-
 Bahrain
-
 Bangladesh
-
 Belarus
-
 Belgium
-
 Bolivia
-
 Botswana
-
 Brazil
-
 Brunei
-
 Bulgaria
-
 Cambodia
-
 Cameroon
-
 Canada
-
 Chile
Chile
-
 China
China
-
 Colombia
-
 Congo
Congo
-
 Costa Rica
-
 Cote d'Ivoire
-
 Croatia
-
 Cuba
Cuba
-
 Cyprus
-
 Czechia
-
 DR Congo
-
 Denmark
-
 Dominican Republic
-
 Ecuador
-
 Egypt
Egypt
-
 El Salvador
-
 Estonia
-
 Eswatini
-
 Ethiopia
-
 Finland
-
 France
-
 Georgia
-
 Germany
-
 Ghana
Ghana
-
 Greece
-
 Haiti
Haiti
-
 Hong Kong
-
 Hungary
-
 India
India
-
 Indonesia
-
 Iran, Islamic republic
-
 Iraq
Iraq
-
 Ireland
-
 Israel
-
 Italy
Italy
-
 Jamaica
-
 Japan
Japan
-
 Jordan
-
 Kazakhstan
-
 Kenya
Kenya
-
 Korea
Korea
-
 Kuwait
-
 Kyrgyzstan
-
 Laos
Laos
-
 Latvia
-
 Lebanon
-
 Lesotho
-
 Libya
Libya
-
 Lithuania
-
 Luxembourg
-
 Madagascar
-
 Malaysia
-
 Malta
Malta
-
 Mauritius
-
 Mexico
-
 Moldova
-
 Mongolia
-
 Montenegro
-
 Morocco
-
 Mozambique
-
 Myanmar
-
 Namibia
-
 Nepal
Nepal
-
 Netherlands
-
 New Zealand
-
 Nigeria
-
 North Macedonia
-
 Norway
-
 Oman
Oman
-
 Pakistan
-
 Palestine
-
 Panama
-
 Papua New Guinea
-
 Paraguay
-
 Peru
Peru
-
 Philippines
-
 Poland
-
 Portugal
-
 Puerto Rico
-
 Qatar
Qatar
-
 Reunion
-
 Romania
-
 Rwanda
-
 Saudi Arabia
-
 Serbia
-
 Singapore
-
 Slovakia
-
 Slovenia
-
 Somalia
-
 South Africa
-
 Spain
Spain
-
 Sri Lanka
-
 Sweden
-
 Switzerland
-
 Syria
Syria
-
 Taiwan
-
 Tajikistan
-
 Tanzania
-
 Thailand
-
 Trinidad and Tobago
-
 Tunisia
-
 Turkey
-
 UAE
UAE
-
 Uganda
-
 Ukraine
-
 United Kingdom
-
United States
-
 Uruguay
-
 Uzbekistan
-
 Venezuela
-
 Vietnam
-
 Yemen
Yemen
-
 Zambia
-
 Zimbabwe
- Forex
- Crypto
