
Trump news live: TRUMP faces resistance at $6.20, downside risk remains high this week

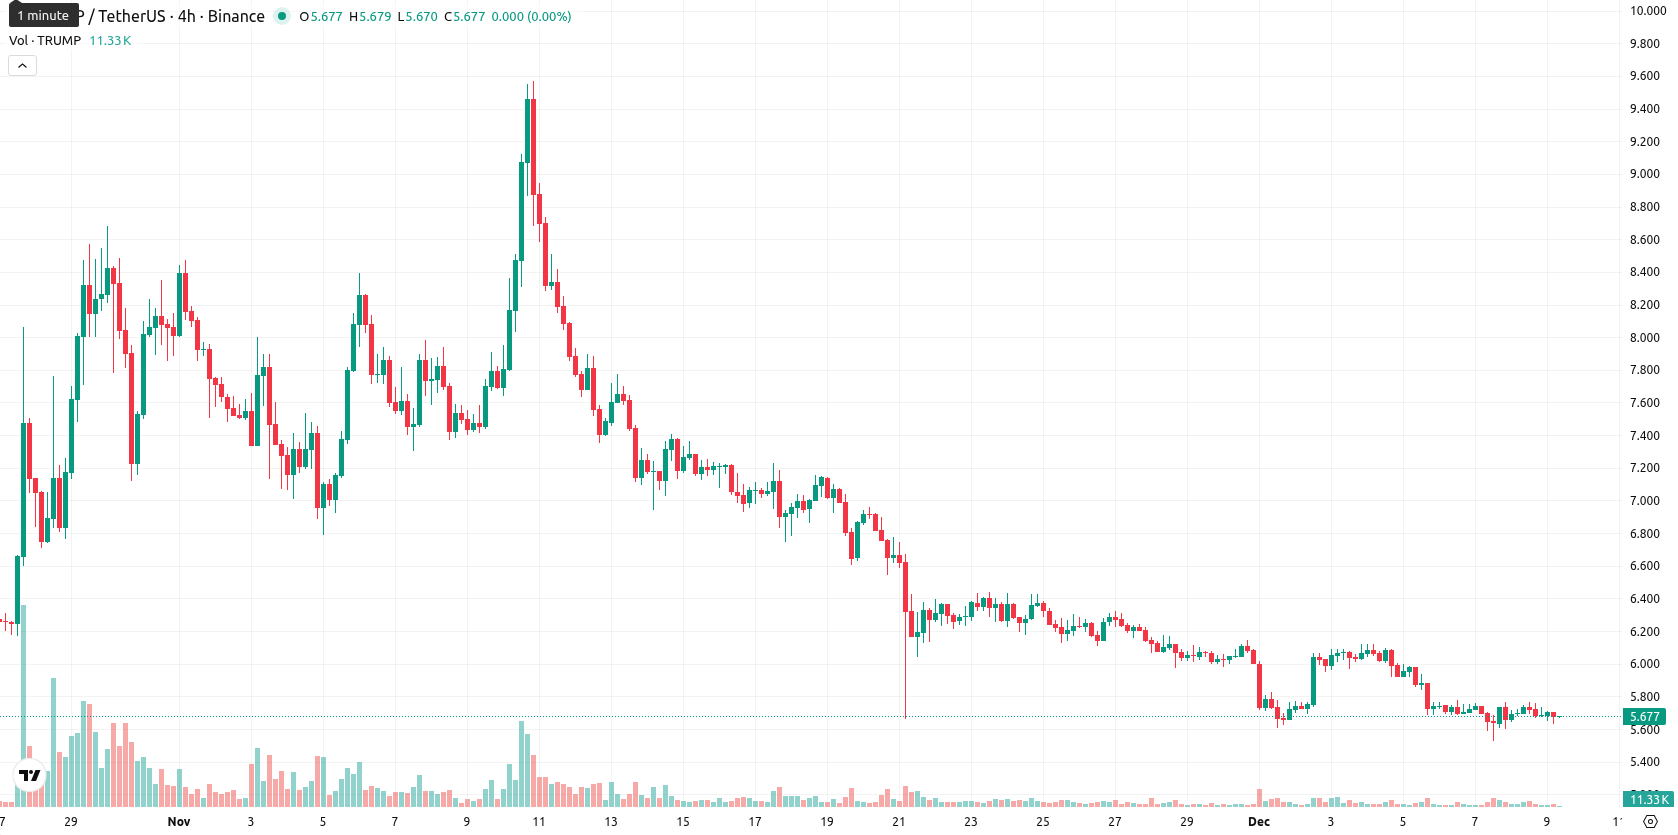
Official Trump (TRUMP) is trading at $5.67, which is below the MA-20 ($6.10), MA-50 ($6.74), and MA-200 ($8.47), confirming persistent downward pressure across short-, medium-, and long-term horizons. The nearest dynamic resistance is the Ichimoku Kijun at $6.65, with no significant Ichimoku support below current price.
Highlights
- TRUMP trades at $5.67, below the MA-20 ($6.10), MA-50 ($6.74), and MA-200 ($8.47), confirming sustained downward pressure across all timeframes.
- Momentum remains strongly bearish with key indicators (MACD, ADX, RSI 36.15 D1, 27.09 W1, and CCI –111.64) signaling limited buying interest and prevailing oversold conditions.
- Near-term consolidation is expected between $5.60–$6.20, with less than 20% probability of a price increase and risk skewed toward additional downside if $5.60 breaks.
Bearish momentum firms as oversold readings deepen without reversal
Momentum signals remain decisively bearish, with both MACD and ADX on daily and weekly timeframes indicating a strong downtrend and limited buying interest. RSI (36.15 D1, 27.09 W1) and CCI (–111.64) readings show the asset nearing or in oversold territory, but Stochastic RSI hints at some short-term oversold conditions, while BBP at –0.18 confirms sellers maintain control. The Awesome Oscillator remains neutral, offering no countertrend support. Today saw no gap at the open, as price dipped slightly from $5.71 to $5.69, and has since edged lower to $5.67 — positioned near today’s low ($5.63) in a relatively narrow range, reflecting low volatility and steady selling pressure after the open. While HMA gives a rare "Strong Buy," the broader picture is dominated by bearish momentum; this divergence highlights growing oversold risks but no clear reversal signal yet.
Downside bias dominates as consolidation expected within defined range
Over the next week, the expected trading range is $5.60 – $6.20, reflecting a typical volatility band relative to current levels and a lack of valid weekly moving average data. The probability of a price increase is very low (less than 20%), making further downside more likely given the string of "Sell" or "Strong Sell" signals from all major weekly indicators. In the baseline scenario, price action is likely to consolidate between support at $5.60 and resistance at $6.20. A bullish scenario would require a decisive move above $6.20, opening space for a short-term recovery; a bearish scenario sees a breakdown below $5.60, which could invite additional selling and test lower supports. For now, the trend remains negative with only early signs of exhaustion from oversold oscillators.
Previously it was reported that TRUMP was trading below all key moving averages and momentum indicators such as MACD, ADX, and RSI continued to signal sustained bearish sentiment. The token was expected to remain within a sideways band between immediate support and resistance, with further downside risk outweighing bullish breakout prospects short term.


-
 Afghanistan
-
 Albania
-
 Algeria
-
 Angola
-
 Argentina
-
 Armenia
-
 Australia
-
 Austria
-
 Azerbaijan
-
 Bahamas
-
 Bahrain
-
 Bangladesh
-
 Belarus
-
 Belgium
-
 Bolivia
-
 Botswana
-
 Brazil
-
 Brunei
-
 Bulgaria
-
 Cambodia
-
 Cameroon
-
 Canada
-
 Chile
Chile
-
 China
China
-
 Colombia
-
 Congo
Congo
-
 Costa Rica
-
 Cote d'Ivoire
-
 Croatia
-
 Cuba
Cuba
-
 Cyprus
-
 Czechia
-
 DR Congo
-
 Denmark
-
 Dominican Republic
-
 Ecuador
-
 Egypt
Egypt
-
 El Salvador
-
 Estonia
-
 Eswatini
-
 Ethiopia
-
 Finland
-
 France
-
 Georgia
-
 Germany
-
 Ghana
Ghana
-
 Greece
-
 Haiti
Haiti
-
 Hong Kong
-
 Hungary
-
 India
India
-
 Indonesia
-
 Iran, Islamic republic
-
 Iraq
Iraq
-
 Ireland
-
 Israel
-
 Italy
Italy
-
 Jamaica
-
 Japan
Japan
-
 Jordan
-
 Kazakhstan
-
 Kenya
Kenya
-
 Korea
Korea
-
 Kuwait
-
 Kyrgyzstan
-
 Laos
Laos
-
 Latvia
-
 Lebanon
-
 Lesotho
-
 Libya
Libya
-
 Lithuania
-
 Luxembourg
-
 Madagascar
-
 Malaysia
-
 Malta
Malta
-
 Mauritius
-
 Mexico
-
 Moldova
-
 Mongolia
-
 Montenegro
-
 Morocco
-
 Mozambique
-
 Myanmar
-
 Namibia
-
 Nepal
Nepal
-
 Netherlands
-
 New Zealand
-
 Nigeria
-
 North Macedonia
-
 Norway
-
 Oman
Oman
-
 Pakistan
-
 Palestine
-
 Panama
-
 Papua New Guinea
-
 Paraguay
-
 Peru
Peru
-
 Philippines
-
 Poland
-
 Portugal
-
 Puerto Rico
-
 Qatar
Qatar
-
 Reunion
-
 Romania
-
 Rwanda
-
 Saudi Arabia
-
 Serbia
-
 Singapore
-
 Slovakia
-
 Slovenia
-
 Somalia
-
 South Africa
-
 Spain
Spain
-
 Sri Lanka
-
 Sweden
-
 Switzerland
-
 Syria
Syria
-
 Taiwan
-
 Tajikistan
-
 Tanzania
-
 Thailand
-
 Trinidad and Tobago
-
 Tunisia
-
 Turkey
-
 UAE
UAE
-
 Uganda
-
 Ukraine
-
 United Kingdom
-
United States
-
 Uruguay
-
 Uzbekistan
-
 Venezuela
-
 Vietnam
-
 Yemen
Yemen
-
 Zambia
-
 Zimbabwe
- Forex
- Crypto
