
TRUMP today news: remains under pressure — bullish reversal requires close above $6.73

Official Trump (TRUMP) is trading at $5.71, representing a modest daily uptick of 0.14%. The asset remains notably below the MA-20 ($6.17), MA-50 ($6.74), and MA-200 ($8.51), highlighting persistent bearish pressure across all observed timeframes.
TRUMP price prediction
Current price:
$ 1.72
-0.04
2.05%
Real-time Data
07:30
Daily range
1.68
 1.73
1.73
Weekly range
1.62
2.02
Loading...
Highlights
- TRUMP trades at $5.71, below MA-20 ($6.17), MA-50 ($6.74), and MA-200 ($8.51), signaling bearish pressure across all time horizons.
- Momentum indicators show a negative bias with D1 MACD, ADX, and BBP bearish, while RSI at 35.32 and CCI at –130.34 indicate oversold conditions.
- Expected five-day range is $5.65 to $6.85, with a higher probability of further declines; a close above $6.73 is required for a bullish reversal.
Oversold signals persist amid seller dominance and weak reversal cues
Momentum signals are negative, with D1 MACD and ADX indicating a sell bias and moderate trend strength, while RSI at 35.32 and CCI at –130.34 both signal mild to clear oversold conditions. Bull/Bear Power (BBP) remains negative, confirming that sellers are dominating intraday momentum. The Awesome Oscillator is neutral, with the current price near the session’s top amid low volatility and persistent, yet subdued, buying interest. Notably, some divergence is present: oscillators highlight oversold conditions, but momentum indicators have yet to confirm a bullish reversal.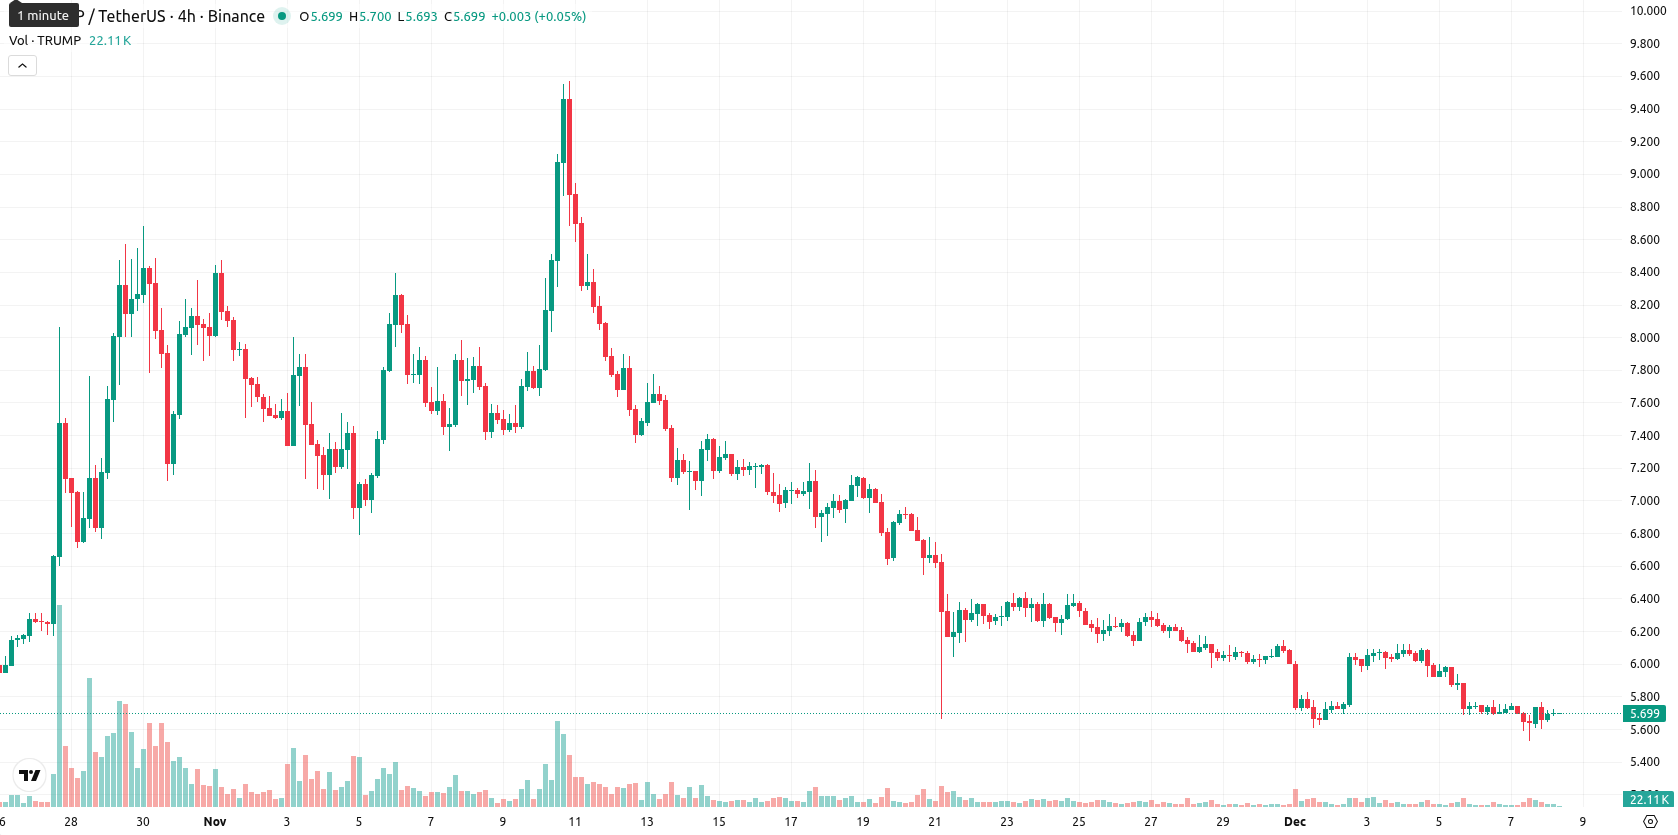
Consolidation likely as downside risk outweighs bullish breakout
For the next five trading days, the expected trading range is $5.65 to $6.85, given typical volatility bands relative to current levels. There is a very low probability (less than 20%) of a price increase, while the chance of further decline is much greater. The baseline scenario calls for TRUMP to consolidate within a sideways band between immediate support and resistance. A bullish case would require a close above $6.73 to signal a potential trend reversal, while a break below $5.65 exposes the token to renewed selling toward new local lows.
Anton Kharitonov, Traders Union expert, notes that TRUMP remains under pressure as price action lags beneath all major moving averages. He sees bearish momentum intact, while oversold oscillators fail to generate a bullish reversal. With sellers dominating, the base case is sideways consolidation unless support at $5.65 breaks. "Until a close above $6.73, risk remains skewed to the downside — I am staying defensive here."
Previously it was reported that TRUMP traded below its key moving averages across all trends, with momentum indicators such as the MACD, ADX, and RSI reinforcing sustained bearish sentiment and pointing toward a lack of buy signals. In the near term, sideways movement within a typical volatility band between prevailing support and resistance levels is expected, absent strong bullish catalysts.
Source of Data:
TRUMP Price Analysis by TU
The analysis is based on a proprietary model combining technical, on-chain, and expert data. Not investment advice. See
methodology
The information is based on forecasts and does not constitute investment advice or a guarantee of future results. Market conditions may change. See our Disclaimer and Editorial Integrity for details.
Subscribe to TU news

Did you like the article?


Weekly Top Bonuses

Top News


Top 5 companies for you

United States
-
 Afghanistan
-
 Albania
-
 Algeria
-
 Angola
-
 Argentina
-
 Armenia
-
 Australia
-
 Austria
-
 Azerbaijan
-
 Bahamas
-
 Bahrain
-
 Bangladesh
-
 Belarus
-
 Belgium
-
 Bolivia
-
 Botswana
-
 Brazil
-
 Brunei
-
 Bulgaria
-
 Cambodia
-
 Cameroon
-
 Canada
-
 Chile
Chile
-
 China
China
-
 Colombia
-
 Congo
Congo
-
 Costa Rica
-
 Cote d'Ivoire
-
 Croatia
-
 Cuba
Cuba
-
 Cyprus
-
 Czechia
-
 DR Congo
-
 Denmark
-
 Dominican Republic
-
 Ecuador
-
 Egypt
Egypt
-
 El Salvador
-
 Estonia
-
 Eswatini
-
 Ethiopia
-
 Finland
-
 France
-
 Georgia
-
 Germany
-
 Ghana
Ghana
-
 Greece
-
 Haiti
Haiti
-
 Hong Kong
-
 Hungary
-
 India
India
-
 Indonesia
-
 Iran, Islamic republic
-
 Iraq
Iraq
-
 Ireland
-
 Israel
-
 Italy
Italy
-
 Jamaica
-
 Japan
Japan
-
 Jordan
-
 Kazakhstan
-
 Kenya
Kenya
-
 Korea
Korea
-
 Kuwait
-
 Kyrgyzstan
-
 Laos
Laos
-
 Latvia
-
 Lebanon
-
 Lesotho
-
 Libya
Libya
-
 Lithuania
-
 Luxembourg
-
 Madagascar
-
 Malaysia
-
 Malta
Malta
-
 Mauritius
-
 Mexico
-
 Moldova
-
 Mongolia
-
 Montenegro
-
 Morocco
-
 Mozambique
-
 Myanmar
-
 Namibia
-
 Nepal
Nepal
-
 Netherlands
-
 New Zealand
-
 Nigeria
-
 North Macedonia
-
 Norway
-
 Oman
Oman
-
 Pakistan
-
 Palestine
-
 Panama
-
 Papua New Guinea
-
 Paraguay
-
 Peru
Peru
-
 Philippines
-
 Poland
-
 Portugal
-
 Puerto Rico
-
 Qatar
Qatar
-
 Reunion
-
 Romania
-
 Rwanda
-
 Saudi Arabia
-
 Serbia
-
 Singapore
-
 Slovakia
-
 Slovenia
-
 Somalia
-
 South Africa
-
 Spain
Spain
-
 Sri Lanka
-
 Sweden
-
 Switzerland
-
 Syria
Syria
-
 Taiwan
-
 Tajikistan
-
 Tanzania
-
 Thailand
-
 Trinidad and Tobago
-
 Tunisia
-
 Turkey
-
 UAE
UAE
-
 Uganda
-
 Ukraine
-
 United Kingdom
-
United States
-
 Uruguay
-
 Uzbekistan
-
 Venezuela
-
 Vietnam
-
 Yemen
Yemen
-
 Zambia
-
 Zimbabwe
- Forex
- Crypto
Live News
