
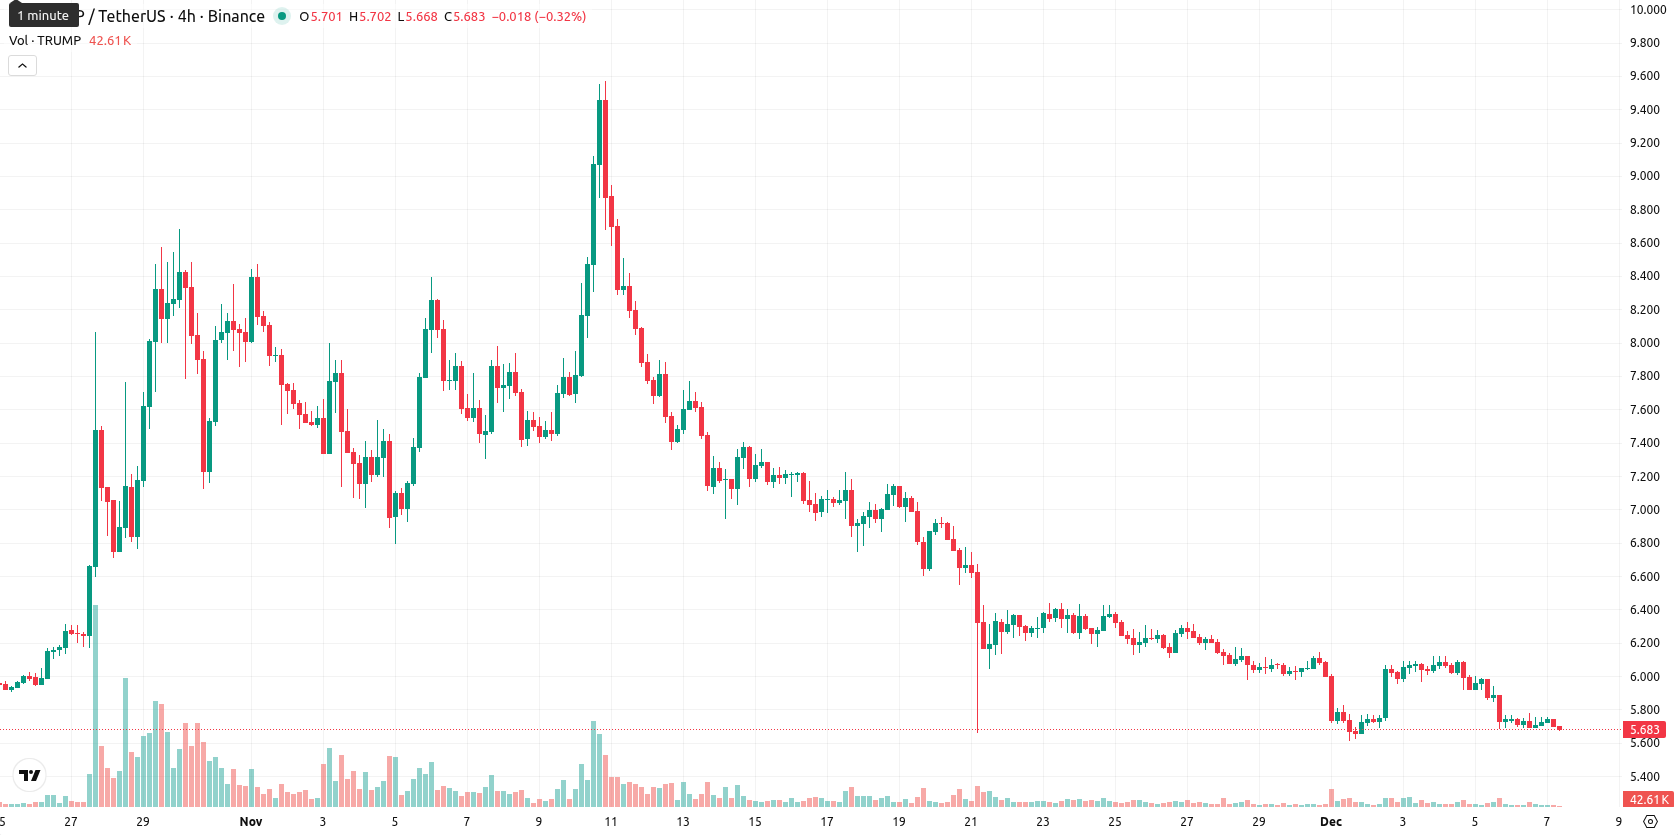
Low volatility supports Trump — consolidation near session lows after persistent downside pressure

Official Trump (TRUMP) is trading at $5.73, which is notably below its MA-20 ($6.23), MA-50 ($6.75), and MA-200 ($8.56) on the daily chart. This highlights persistent downside pressure across all trends.
Highlights
- The TRUMP token trades at $5.73, below its MA-20 ($6.23), MA-50 ($6.75), and MA-200 ($8.56), signaling sustained bearish pressure across all timeframes.
- Momentum indicators including MACD, ADX, and RSI (36.06) remain in sell territory, while CCI signals oversold conditions and intraday trading shows mild downside pressure near session lows.
- The five-day forecast range is $5.45 to $6.25, with less than 20% probability of a meaningful price increase and baseline expectations for continued sideways or downward movement unless $6.25 is surpassed.
Sustained bearish momentum as indicators reinforce seller control
Momentum indicators remain weak, with both the daily MACD and ADX signaling a continued sell stance and a lack of bullish conviction. The daily RSI sits in sell territory at 36.06, while the CCI marks oversold conditions and the Stoch RSI remains near neutral, indicating hesitation in the market. The Bull/Bear Power is negative and also forecasts a sell, confirming seller dominance for intraday sessions. The Awesome Oscillator is neutral, while price action near the session lows within the $5.71 – $5.76 range signals low volatility after the open and mild pressure; oversold oscillators hint at possible stabilization, but overall momentum is still decisively bearish.
Sideways trading likely as bullish catalysts remain absent
Over the next five days, TRUMP is expected to trade within a typical volatility band between $5.45 and $6.25, consistent with recent market patterns. The probability of a significant price increase remains very low, under 20%, given the absence of buy signals from weekly momentum and moving averages. The base scenario calls for mostly sideways movement in this corridor. A decisive close above $6.25 would challenge resistance at the Ichimoku Kijun ($7.28), while a drop below $5.45 could lead to further declines.
Previously it was reported that TRUMP remained under key moving averages with persistent bearish momentum, while technical indicators such as the MACD, RSI, and ADX continued to suggest mounting downside risks and an approaching oversold state. Resistance is capped by the Ichimoku Kijun level and sellers firmly dominate today’s session, as consolidative price action is likely to remain contained within prevailing volatility bands.


-
 Afghanistan
-
 Albania
-
 Algeria
-
 Angola
-
 Argentina
-
 Armenia
-
 Australia
-
 Austria
-
 Azerbaijan
-
 Bahamas
-
 Bahrain
-
 Bangladesh
-
 Belarus
-
 Belgium
-
 Bolivia
-
 Botswana
-
 Brazil
-
 Brunei
-
 Bulgaria
-
 Cambodia
-
 Cameroon
-
 Canada
-
 Chile
Chile
-
 China
China
-
 Colombia
-
 Congo
Congo
-
 Costa Rica
-
 Cote d'Ivoire
-
 Croatia
-
 Cuba
Cuba
-
 Cyprus
-
 Czechia
-
 DR Congo
-
 Denmark
-
 Dominican Republic
-
 Ecuador
-
 Egypt
Egypt
-
 El Salvador
-
 Estonia
-
 Eswatini
-
 Ethiopia
-
 Finland
-
 France
-
 Georgia
-
 Germany
-
 Ghana
Ghana
-
 Greece
-
 Haiti
Haiti
-
 Hong Kong
-
 Hungary
-
 India
India
-
 Indonesia
-
 Iran, Islamic republic
-
 Iraq
Iraq
-
 Ireland
-
 Israel
-
 Italy
Italy
-
 Jamaica
-
 Japan
Japan
-
 Jordan
-
 Kazakhstan
-
 Kenya
Kenya
-
 Korea
Korea
-
 Kuwait
-
 Kyrgyzstan
-
 Laos
Laos
-
 Latvia
-
 Lebanon
-
 Lesotho
-
 Libya
Libya
-
 Lithuania
-
 Luxembourg
-
 Madagascar
-
 Malaysia
-
 Malta
Malta
-
 Mauritius
-
 Mexico
-
 Moldova
-
 Mongolia
-
 Montenegro
-
 Morocco
-
 Mozambique
-
 Myanmar
-
 Namibia
-
 Nepal
Nepal
-
 Netherlands
-
 New Zealand
-
 Nigeria
-
 North Macedonia
-
 Norway
-
 Oman
Oman
-
 Pakistan
-
 Palestine
-
 Panama
-
 Papua New Guinea
-
 Paraguay
-
 Peru
Peru
-
 Philippines
-
 Poland
-
 Portugal
-
 Puerto Rico
-
 Qatar
Qatar
-
 Reunion
-
 Romania
-
 Rwanda
-
 Saudi Arabia
-
 Serbia
-
 Singapore
-
 Slovakia
-
 Slovenia
-
 Somalia
-
 South Africa
-
 Spain
Spain
-
 Sri Lanka
-
 Sweden
-
 Switzerland
-
 Syria
Syria
-
 Taiwan
-
 Tajikistan
-
 Tanzania
-
 Thailand
-
 Trinidad and Tobago
-
 Tunisia
-
 Turkey
-
 UAE
UAE
-
 Uganda
-
 Ukraine
-
 United Kingdom
-
United States
-
 Uruguay
-
 Uzbekistan
-
 Venezuela
-
 Vietnam
-
 Yemen
Yemen
-
 Zambia
-
 Zimbabwe
- Forex
- Crypto
