
Trump today news: consolidates between $5.40 and $6.31 as technicals reinforce downtrend

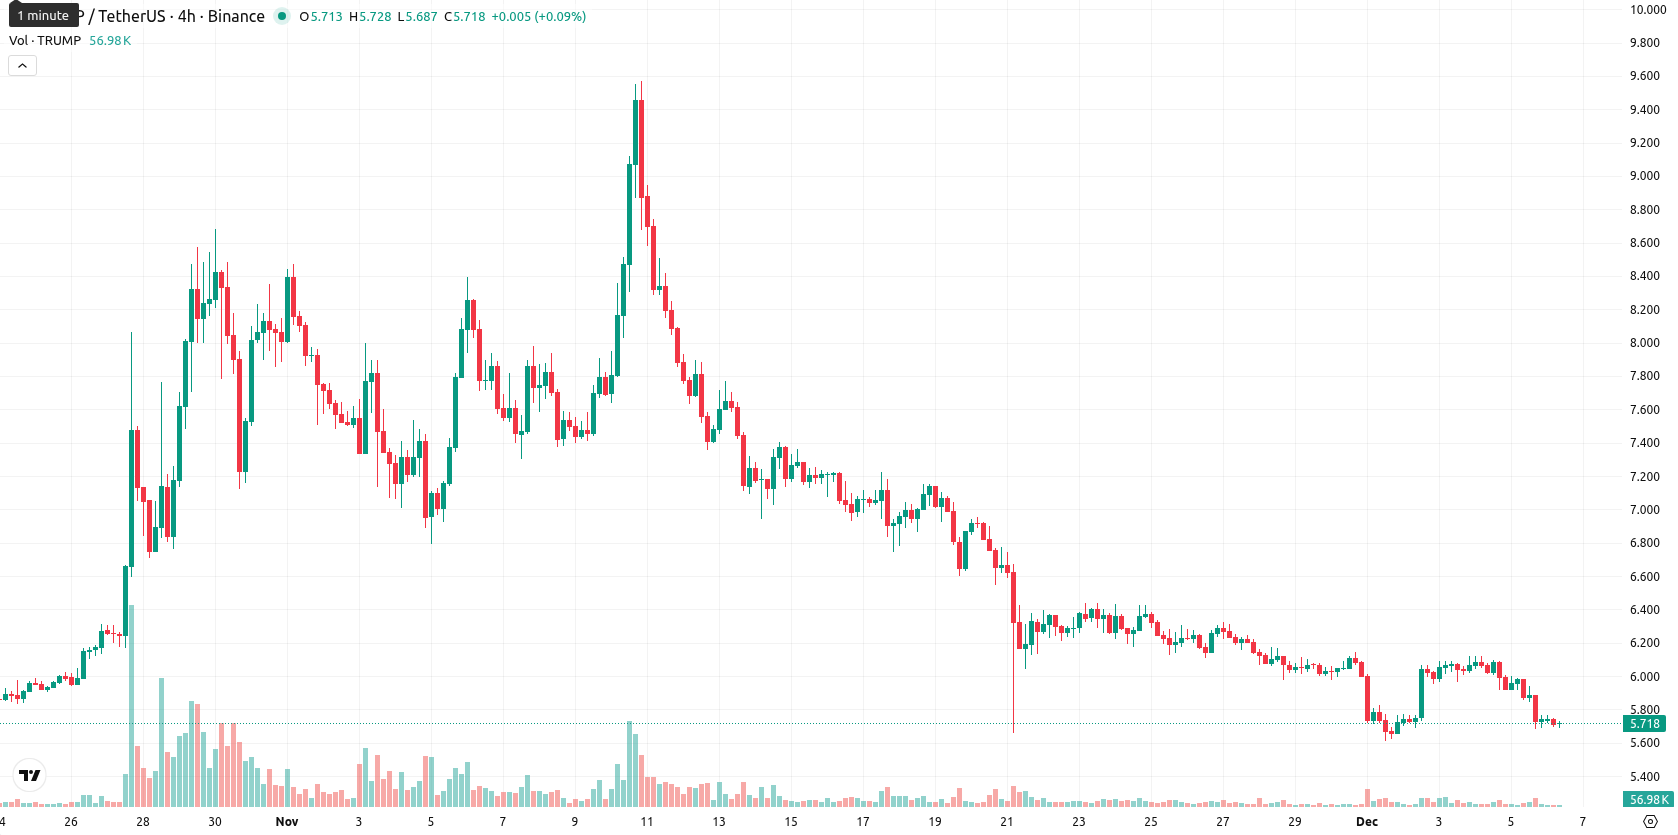
Official Trump (TRUMP) is trading at $5.72, down 4.04% on the day and positioned below its MA-20 ($6.30), MA-50 ($6.75), and MA-200 ($8.60), signaling persistent downward momentum across all key timeframes.
Highlights
- TRUMP trades at $5.72, down 4.04% today and below its MA-20 ($6.30), MA-50 ($6.75), and MA-200 ($8.60), underscoring persistent multi-timeframe bearish pressure.
- Oscillator readings—RSI (36.43), Stoch RSI (34.83), CCI (-107.76)—and bearish MACD signal highlight mounting seller dominance and near-oversold conditions amid weak directional conviction.
- Expected price range for the coming week is $5.40–$6.31 with less than 20% probability of meaningful upside, baseline scenario favors further downside or range-bound consolidation.
Bearish signals accelerate as indicators point to oversold risk
The nearest dynamic resistance for Trump is marked by the Ichimoku Kijun level at $7.59, with no significant support indicated nearby. Technical indicators reinforce a bearish outlook: both the MACD signals sell and the ADX remains neutral with low strength, while momentum oscillators such as RSI (36.43), Stoch RSI (34.83), and CCI (-107.76) point toward a developing or nearing oversold condition. The Bull/Bear Power (BBP) reading is negative, indicating sellers firmly dominate today’s session, aligned with the prevailing downtrend. The Awesome Oscillator is neutral, giving no additional confirmation, and there are no major divergence signals across intraday readings.
Range-bound outlook favors decline as volatility constrains upside
For the coming week, Trump is expected to trade between $5.40 and $6.31, which represents a typical volatility band relative to current levels. Downside remains the more probable scenario, with a low probability (less than 20%) for a meaningful upside move. The baseline expectation is for the price to consolidate within this range. Should bullish momentum briefly materialize, a move toward resistance at $6.31 could occur; on weakness, a break below $5.40 may trigger a sharper decline due to prevailing bearish sentiment.
Previously it was reported that TRUMP remained below key moving averages with weak momentum confirmed by continued bearish signals in MACD, RSI, and ADX, indicating ongoing downside pressure. Last week’s analysis anticipated sideways consolidation amid low volatility and persistent technical weakness, while a break below the established trading band would expose the asset to further risk, as detailed in sideways consolidation amid persistent bearish conditions.


-
 Afghanistan
-
 Albania
-
 Algeria
-
 Angola
-
 Argentina
-
 Armenia
-
 Australia
-
 Austria
-
 Azerbaijan
-
 Bahamas
-
 Bahrain
-
 Bangladesh
-
 Belarus
-
 Belgium
-
 Bolivia
-
 Botswana
-
 Brazil
-
 Brunei
-
 Bulgaria
-
 Cambodia
-
 Cameroon
-
 Canada
-
 Chile
Chile
-
 China
China
-
 Colombia
-
 Congo
Congo
-
 Costa Rica
-
 Cote d'Ivoire
-
 Croatia
-
 Cuba
Cuba
-
 Cyprus
-
 Czechia
-
 DR Congo
-
 Denmark
-
 Dominican Republic
-
 Ecuador
-
 Egypt
Egypt
-
 El Salvador
-
 Estonia
-
 Eswatini
-
 Ethiopia
-
 Finland
-
 France
-
 Georgia
-
 Germany
-
 Ghana
Ghana
-
 Greece
-
 Haiti
Haiti
-
 Hong Kong
-
 Hungary
-
 India
India
-
 Indonesia
-
 Iran, Islamic republic
-
 Iraq
Iraq
-
 Ireland
-
 Israel
-
 Italy
Italy
-
 Jamaica
-
 Japan
Japan
-
 Jordan
-
 Kazakhstan
-
 Kenya
Kenya
-
 Korea
Korea
-
 Kuwait
-
 Kyrgyzstan
-
 Laos
Laos
-
 Latvia
-
 Lebanon
-
 Lesotho
-
 Libya
Libya
-
 Lithuania
-
 Luxembourg
-
 Madagascar
-
 Malaysia
-
 Malta
Malta
-
 Mauritius
-
 Mexico
-
 Moldova
-
 Mongolia
-
 Montenegro
-
 Morocco
-
 Mozambique
-
 Myanmar
-
 Namibia
-
 Nepal
Nepal
-
 Netherlands
-
 New Zealand
-
 Nigeria
-
 North Macedonia
-
 Norway
-
 Oman
Oman
-
 Pakistan
-
 Palestine
-
 Panama
-
 Papua New Guinea
-
 Paraguay
-
 Peru
Peru
-
 Philippines
-
 Poland
-
 Portugal
-
 Puerto Rico
-
 Qatar
Qatar
-
 Reunion
-
 Romania
-
 Rwanda
-
 Saudi Arabia
-
 Serbia
-
 Singapore
-
 Slovakia
-
 Slovenia
-
 Somalia
-
 South Africa
-
 Spain
Spain
-
 Sri Lanka
-
 Sweden
-
 Switzerland
-
 Syria
Syria
-
 Taiwan
-
 Tajikistan
-
 Tanzania
-
 Thailand
-
 Trinidad and Tobago
-
 Tunisia
-
 Turkey
-
 UAE
UAE
-
 Uganda
-
 Ukraine
-
 United Kingdom
-
United States
-
 Uruguay
-
 Uzbekistan
-
 Venezuela
-
 Vietnam
-
 Yemen
Yemen
-
 Zambia
-
 Zimbabwe
- Forex
- Crypto
