
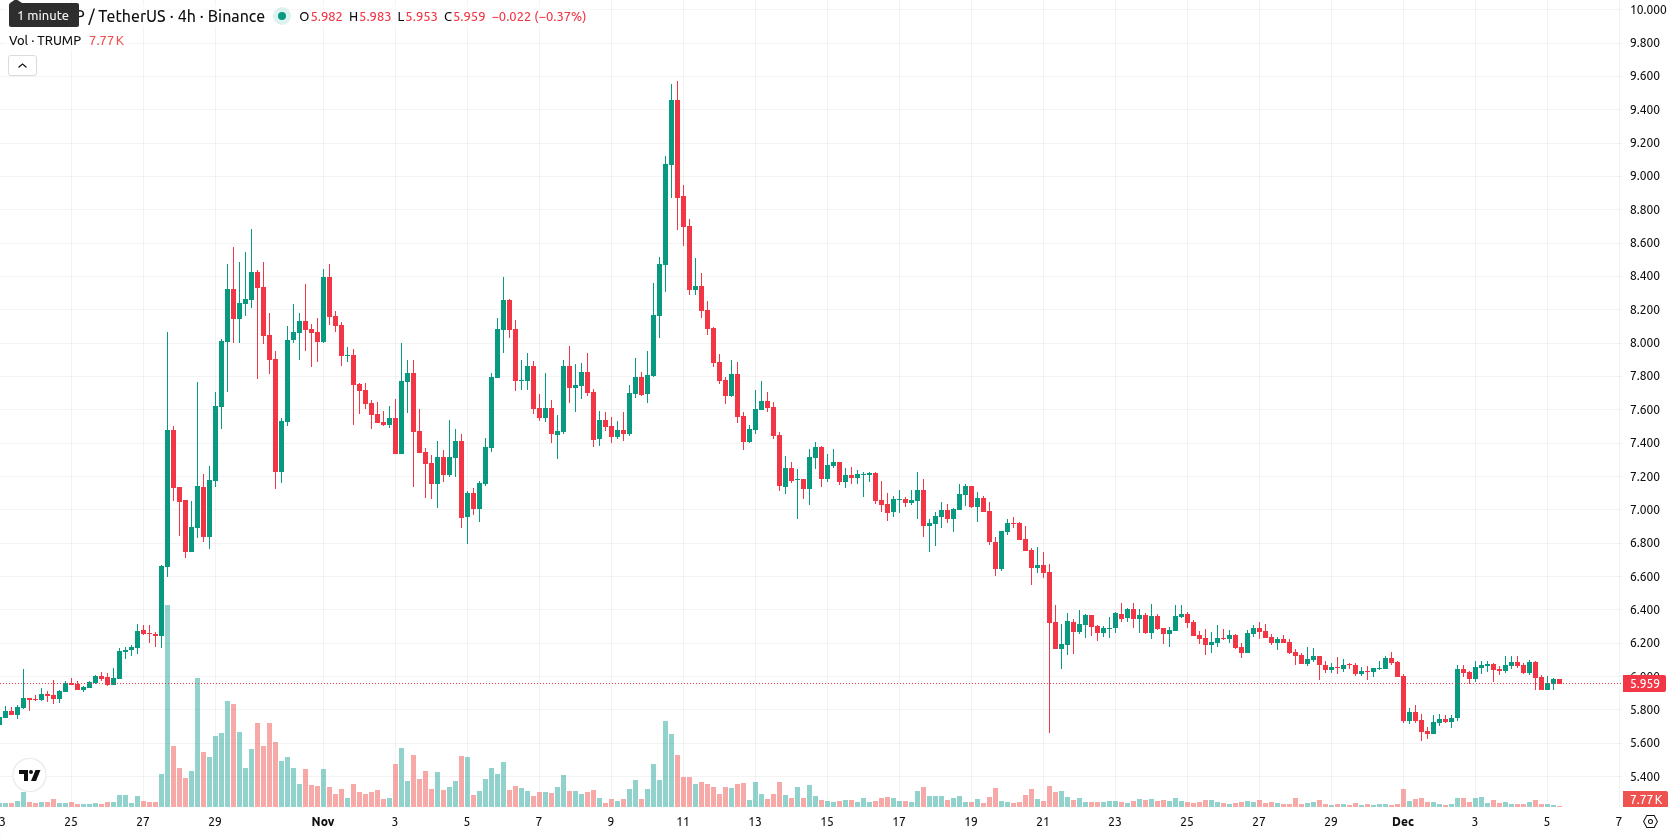
Trump news live: consolidates near $5.98 as oscillators confirm seller dominance

Official Trump (TRUMP) is trading at $5.98, remaining below key moving averages: MA-20 ($6.38), MA-50 ($6.75), and MA-200 ($8.63), which signals short-, medium-, and long-term downside pressure. The closest dynamic resistance is the Ichimoku Kijun at $7.59, with no strong immediate support indicated by Ichimoku on D1.
Highlights
- TRUMP trades at $5.98, staying below key moving averages—MA-20 ($6.38), MA-50 ($6.75), and MA-200 ($8.63)—indicating short-, medium-, and long-term bearish momentum.
- Technical signals remain bearish with D1 MACD and RSI (39.57) both on sell, ADX at 19.52 showing weak trend strength, and CCI at –71.52 confirming ongoing selling pressure.
- The price is consolidating in a narrow intraday range ($5.92–$6.00) with low volatility, and the probable trading band for the coming week is $5.66–$6.56, favoring further downside risk.
Weak momentum and low volatility limit bullish reversal
Momentum remains weak, as MACD on D1 signals a sell and ADX at 19.52 shows low trend strength, while oscillators reflect prevailing bearishness: D1 RSI is at 39.57 (sell), Stochastic RSI is neutral, and CCI at –71.52 also signals a sell. BBP's negative value (–0.05, sell) confirms seller dominance intraday. There was no meaningful gap between yesterday’s close ($6.06) and today’s open ($5.93). The current price sits close to the intraday high within a narrow daily range ($5.92 – $6.00), indicating low volatility and persistent pressure after the open. Several oscillators remain neutral or diverge, which points to a lack of strong bullish momentum.
Sideways consolidation likely amid persistent bearish technical signals
For the coming week, the trading band is expected between $5.66 and $6.56, capturing typical volatility relative to current levels. The probability of a price increase is very low (less than 20%), while persistent sell signals in the weekly RSI, ADX, and MACD point to a higher risk of continued declines. Baseline scenario: price consolidates sideways in the $5.66 – $6.56 band. Bullish scenario: a breakout above $6.56 could target higher levels if momentum improves; bearish scenario: a break below $5.66 would expose the market to further downside risk.
Previously it was reported that TRUMP was trading below all major moving averages, with technical signals indicating sustained downward pressure and choppy short-term sentiment. Momentum and oscillators remained conflicted, with weak bearish bias favored and the asset likely to consolidate near the recent sideways market tone.


-
 Afghanistan
-
 Albania
-
 Algeria
-
 Angola
-
 Argentina
-
 Armenia
-
 Australia
-
 Austria
-
 Azerbaijan
-
 Bahamas
-
 Bahrain
-
 Bangladesh
-
 Belarus
-
 Belgium
-
 Bolivia
-
 Botswana
-
 Brazil
-
 Brunei
-
 Bulgaria
-
 Cambodia
-
 Cameroon
-
 Canada
-
 Chile
Chile
-
 China
China
-
 Colombia
-
 Congo
Congo
-
 Costa Rica
-
 Cote d'Ivoire
-
 Croatia
-
 Cuba
Cuba
-
 Cyprus
-
 Czechia
-
 DR Congo
-
 Denmark
-
 Dominican Republic
-
 Ecuador
-
 Egypt
Egypt
-
 El Salvador
-
 Estonia
-
 Eswatini
-
 Ethiopia
-
 Finland
-
 France
-
 Georgia
-
 Germany
-
 Ghana
Ghana
-
 Greece
-
 Haiti
Haiti
-
 Hong Kong
-
 Hungary
-
 India
India
-
 Indonesia
-
 Iran, Islamic republic
-
 Iraq
Iraq
-
 Ireland
-
 Israel
-
 Italy
Italy
-
 Jamaica
-
 Japan
Japan
-
 Jordan
-
 Kazakhstan
-
 Kenya
Kenya
-
 Korea
Korea
-
 Kuwait
-
 Kyrgyzstan
-
 Laos
Laos
-
 Latvia
-
 Lebanon
-
 Lesotho
-
 Libya
Libya
-
 Lithuania
-
 Luxembourg
-
 Madagascar
-
 Malaysia
-
 Malta
Malta
-
 Mauritius
-
 Mexico
-
 Moldova
-
 Mongolia
-
 Montenegro
-
 Morocco
-
 Mozambique
-
 Myanmar
-
 Namibia
-
 Nepal
Nepal
-
 Netherlands
-
 New Zealand
-
 Nigeria
-
 North Macedonia
-
 Norway
-
 Oman
Oman
-
 Pakistan
-
 Palestine
-
 Panama
-
 Papua New Guinea
-
 Paraguay
-
 Peru
Peru
-
 Philippines
-
 Poland
-
 Portugal
-
 Puerto Rico
-
 Qatar
Qatar
-
 Reunion
-
 Romania
-
 Rwanda
-
 Saudi Arabia
-
 Serbia
-
 Singapore
-
 Slovakia
-
 Slovenia
-
 Somalia
-
 South Africa
-
 Spain
Spain
-
 Sri Lanka
-
 Sweden
-
 Switzerland
-
 Syria
Syria
-
 Taiwan
-
 Tajikistan
-
 Tanzania
-
 Thailand
-
 Trinidad and Tobago
-
 Tunisia
-
 Turkey
-
 UAE
UAE
-
 Uganda
-
 Ukraine
-
 United Kingdom
-
United States
-
 Uruguay
-
 Uzbekistan
-
 Venezuela
-
 Vietnam
-
 Yemen
Yemen
-
 Zambia
-
 Zimbabwe
- Forex
- Crypto
