
FLOW latest news: Intraday volatility surges, downside risk grows with weak demand signals

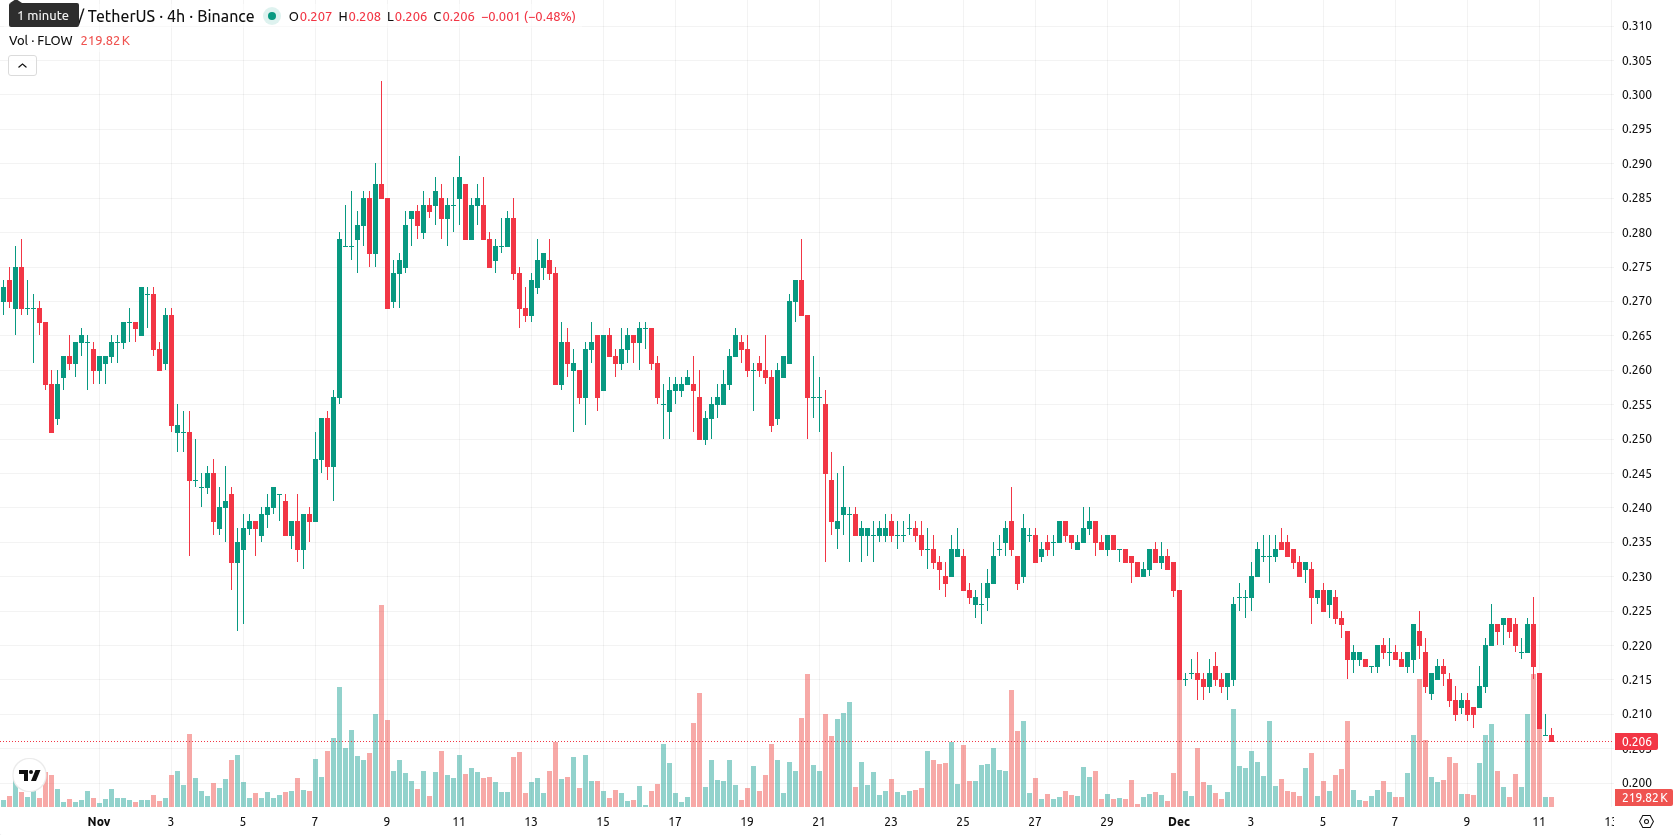
Flow (FLOW) is trading at $0.206, notably below its MA-20 ($0.2274), MA-50 ($0.2497), and MA-200 ($0.3396), which highlights persistent downward pressure across all timeframes.
Highlights
- FLOW trades at $0.206, below its MA-20 ($0.2274), MA-50 ($0.2497), and MA-200 ($0.3396), indicating persistent multi-timeframe selling pressure.
- Momentum indicators including MACD, ADX, and CCI confirm continuing bearishness, with RSI at 38.44 (D1) and 32.97 (W1), showing clear downside momentum.
- Next five-day expected price range is $0.196 to $0.235, with probability of price increase below 20% and continued declines favored absent a breakout above $0.2440.
Bearish momentum confirmed as resistance holds and volatility spikes
The nearest dynamic resistance for FLOW is marked by the daily Ichimoku Kijun level at $0.2440, while support is likely forming near recent lows. Momentum indicators confirm strong bearishness: the MACD and ADX suggest ongoing selling strength, RSI shows 38.44 on the daily and 32.97 on the weekly chart (not yet oversold, but with clear bearish momentum), and the CCI aligns with this view. Stoch RSI remains neutral on D1; BBP is barely positive, indicating weak buyer attempts, while there is no support from the Awesome Oscillator. Price action in the current session shows a rapid 7.21% decline to the lower end of the $0.207–$0.217 range, with moderate to high intraday volatility and minimal signs of reversal.
Decline risk dominates as weekly signals remain uniformly negative
Over the next five trading days, a typical volatility band is expected between $0.196 and $0.235 around the current price. The probability of a price increase is low (less than 20%), with further declines more likely given the uniform 'Sell' signals from major weekly indicators. The baseline scenario sees FLOW remaining in a broad sideways corridor amid weak demand and ongoing pressure. A move above $0.2440 would open a bullish test of higher resistance, while a drop below $0.196 could trigger new multiweek lows.
Previously it was reported that FLOW remained under persistent bearish momentum, trading below key moving averages and consolidating within a narrow volatility band despite a sharp daily gain. Technical indicators — including negative MACD, oversold oscillators, and immediate resistance identified by the daily Ichimoku Kijun — highlighted continued downside risk, with a sustained upward move through today's range reflecting increased intraday volatility but not a shift in the overall bearish trend.


-
 Afghanistan
-
 Albania
-
 Algeria
-
 Angola
-
 Argentina
-
 Armenia
-
 Australia
-
 Austria
-
 Azerbaijan
-
 Bahamas
-
 Bahrain
-
 Bangladesh
-
 Belarus
-
 Belgium
-
 Bolivia
-
 Botswana
-
 Brazil
-
 Brunei
-
 Bulgaria
-
 Cambodia
-
 Cameroon
-
 Canada
-
 Chile
Chile
-
 China
China
-
 Colombia
-
 Congo
Congo
-
 Costa Rica
-
 Cote d'Ivoire
-
 Croatia
-
 Cuba
Cuba
-
 Cyprus
-
 Czechia
-
 DR Congo
-
 Denmark
-
 Dominican Republic
-
 Ecuador
-
 Egypt
Egypt
-
 El Salvador
-
 Estonia
-
 Eswatini
-
 Ethiopia
-
 Finland
-
 France
-
 Georgia
-
 Germany
-
 Ghana
Ghana
-
 Greece
-
 Haiti
Haiti
-
 Hong Kong
-
 Hungary
-
 India
India
-
 Indonesia
-
 Iran, Islamic republic
-
 Iraq
Iraq
-
 Ireland
-
 Israel
-
 Italy
Italy
-
 Jamaica
-
 Japan
Japan
-
 Jordan
-
 Kazakhstan
-
 Kenya
Kenya
-
 Korea
Korea
-
 Kuwait
-
 Kyrgyzstan
-
 Laos
Laos
-
 Latvia
-
 Lebanon
-
 Lesotho
-
 Libya
Libya
-
 Lithuania
-
 Luxembourg
-
 Madagascar
-
 Malaysia
-
 Malta
Malta
-
 Mauritius
-
 Mexico
-
 Moldova
-
 Mongolia
-
 Montenegro
-
 Morocco
-
 Mozambique
-
 Myanmar
-
 Namibia
-
 Nepal
Nepal
-
 Netherlands
-
 New Zealand
-
 Nigeria
-
 North Macedonia
-
 Norway
-
 Oman
Oman
-
 Pakistan
-
 Palestine
-
 Panama
-
 Papua New Guinea
-
 Paraguay
-
 Peru
Peru
-
 Philippines
-
 Poland
-
 Portugal
-
 Puerto Rico
-
 Qatar
Qatar
-
 Reunion
-
 Romania
-
 Rwanda
-
 Saudi Arabia
-
 Serbia
-
 Singapore
-
 Slovakia
-
 Slovenia
-
 Somalia
-
 South Africa
-
 Spain
Spain
-
 Sri Lanka
-
 Sweden
-
 Switzerland
-
 Syria
Syria
-
 Taiwan
-
 Tajikistan
-
 Tanzania
-
 Thailand
-
 Trinidad and Tobago
-
 Tunisia
-
 Turkey
-
 UAE
UAE
-
 Uganda
-
 Ukraine
-
 United Kingdom
-
United States
-
 Uruguay
-
 Uzbekistan
-
 Venezuela
-
 Vietnam
-
 Yemen
Yemen
-
 Zambia
-
 Zimbabwe
- Forex
- Crypto
