
Ethena latest news: ENA pressured as daily and weekly signals point to further downside

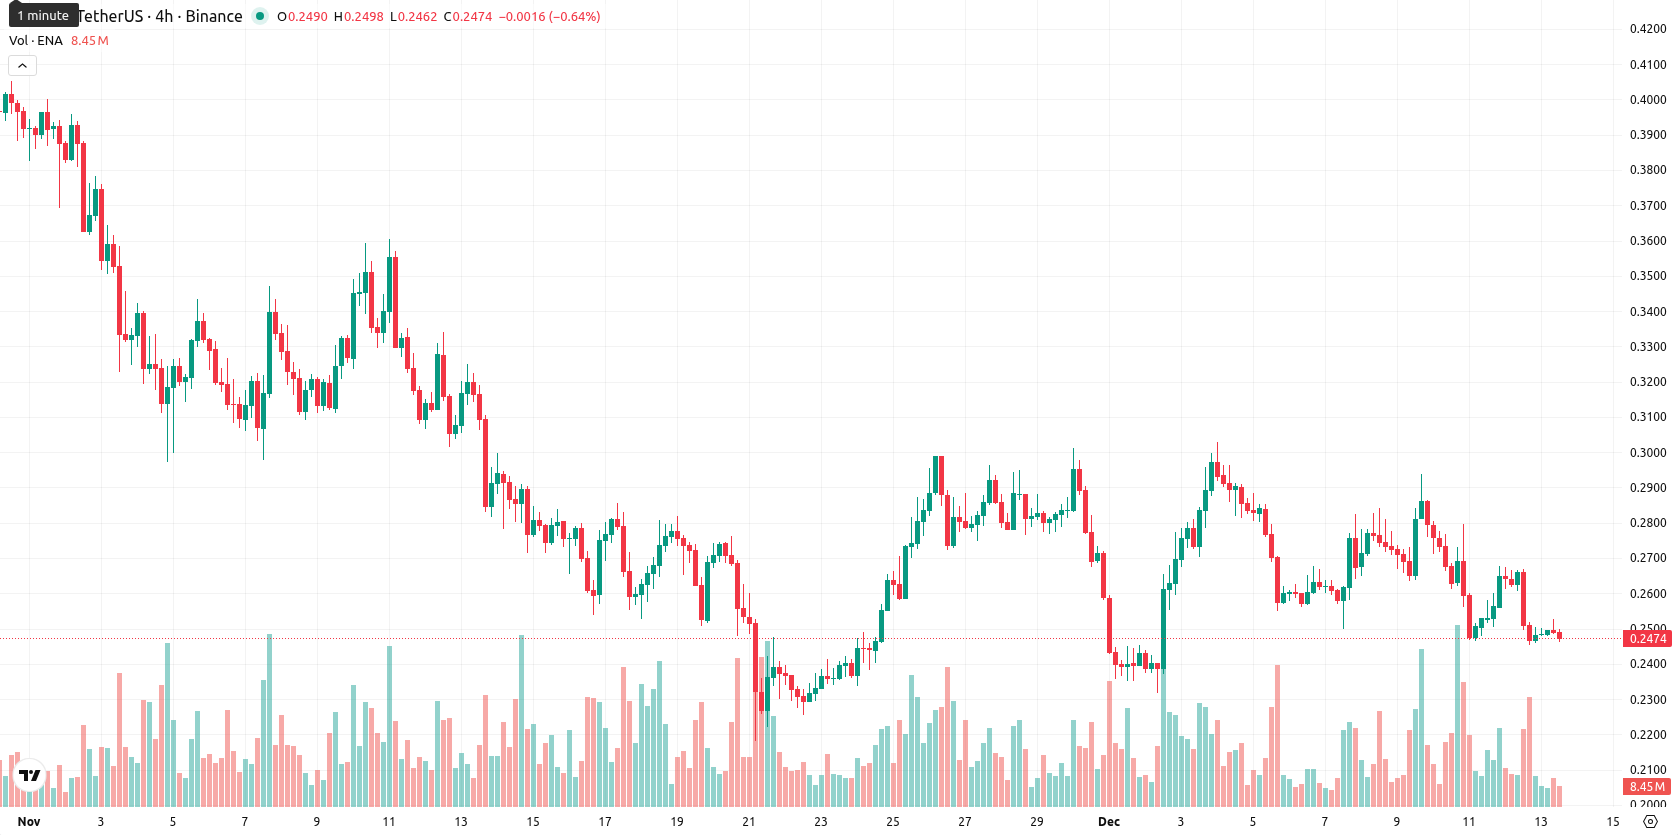
Ethena (ENA) is currently trading at $0.247, staying well below its MA-20 ($0.2692), MA-50 ($0.3136), and MA-200 ($0.4576), which signals persistent downward pressure across all key timeframes. The Kijun level from Ichimoku at $0.2600 now acts as the nearest dynamic resistance, and a lack of recent moving average crosses reinforces the prevailing bearish structure in both the medium and long term.
Highlights
- Ethena-connected protocol treasuries have reached $1.3 billion, indicating significant capitalization and resources available to support ecosystem expansion.
- Recent infrastructure advances and enhanced integrations are driving ongoing maturation across Ethena’s network, positioning it for wider adoption.
- No major updates were reported regarding tokenomics, regulatory matters, or new product launches, highlighting a period of steady development rather than disruptive change.
Network activity expands as tokenomics and regulation remain unchanged
Ethena's ecosystem has seen increasing activity and development, with connected protocol treasuries reaching $1.3 billion, underlining robust resources for further network growth. Recent updates showcase ongoing maturation of its infrastructure and improving integrations, both of which support Ethena's positioning for broader adoption. No major tokenomic changes, regulatory actions, or product launches have been reported.
Persistent sell bias as bearish momentum meets oversold signals
Momentum indicators on the daily chart remain strongly bearish, with both MACD and ADX signaling a sell and confirming sellers' control. The oscillators point to mild oversold conditions, as RSI holds at 40.7, Stoch RSI sits neutral but near oversold, and CCI is negative and leaning oversold. Despite sustained pressure, Bull/Bear Power (BBP) on the daily chart flashes a slight buy bias, showing that buyers are beginning to emerge amid dominant selling. The Awesome Oscillator is neutral, providing no strong indication of trend, while the current session reflects a 7.25% drop with the price holding near session lows in a constrained $0.2464 - $0.2528 range and showing low intraday volatility right after the open.
Downside risks dominate as volatility bands forecast constrained trading
Looking ahead to the next 5 trading days, the anticipated volatility band is set between $0.222 and $0.272, aligning with recent price action. Technical signals from the weekly chart — including the weekly MA-50, MACD, and RSI — all continue to call for a sell, indicating a strong likelihood of continued downside or sideways movement within this range. A bullish scenario would require a decisive break above $0.2600 and sustained closes near $0.272, while any drop below $0.222 would likely expose multi-day lows and intensify downside risk.
Previously it was reported that ENA continued to trade firmly below key moving averages with strong selling pressure and technical indicators such as MACD and RSI aligning with a persistent bearish outlook. Immediate resistance shifted to the Ichimoku Kijun level and, as highlighted in the recent steep intraday decline, the probability of a near-term upside breakout remained notably low.


Latest Ethena News


-
 Afghanistan
-
 Albania
-
 Algeria
-
 Angola
-
 Argentina
-
 Armenia
-
 Australia
-
 Austria
-
 Azerbaijan
-
 Bahamas
-
 Bahrain
-
 Bangladesh
-
 Belarus
-
 Belgium
-
 Bolivia
-
 Botswana
-
 Brazil
-
 Brunei
-
 Bulgaria
-
 Cambodia
-
 Cameroon
-
 Canada
-
 Chile
Chile
-
 China
China
-
 Colombia
-
 Congo
Congo
-
 Costa Rica
-
 Cote d'Ivoire
-
 Croatia
-
 Cuba
Cuba
-
 Cyprus
-
 Czechia
-
 DR Congo
-
 Denmark
-
 Dominican Republic
-
 Ecuador
-
 Egypt
Egypt
-
 El Salvador
-
 Estonia
-
 Eswatini
-
 Ethiopia
-
 Finland
-
 France
-
 Georgia
-
 Germany
-
 Ghana
Ghana
-
 Greece
-
 Haiti
Haiti
-
 Hong Kong
-
 Hungary
-
 India
India
-
 Indonesia
-
 Iran, Islamic republic
-
 Iraq
Iraq
-
 Ireland
-
 Israel
-
 Italy
Italy
-
 Jamaica
-
 Japan
Japan
-
 Jordan
-
 Kazakhstan
-
 Kenya
Kenya
-
 Korea
Korea
-
 Kuwait
-
 Kyrgyzstan
-
 Laos
Laos
-
 Latvia
-
 Lebanon
-
 Lesotho
-
 Libya
Libya
-
 Lithuania
-
 Luxembourg
-
 Madagascar
-
 Malaysia
-
 Malta
Malta
-
 Mauritius
-
 Mexico
-
 Moldova
-
 Mongolia
-
 Montenegro
-
 Morocco
-
 Mozambique
-
 Myanmar
-
 Namibia
-
 Nepal
Nepal
-
 Netherlands
-
 New Zealand
-
 Nigeria
-
 North Macedonia
-
 Norway
-
 Oman
Oman
-
 Pakistan
-
 Palestine
-
 Panama
-
 Papua New Guinea
-
 Paraguay
-
 Peru
Peru
-
 Philippines
-
 Poland
-
 Portugal
-
 Puerto Rico
-
 Qatar
Qatar
-
 Reunion
-
 Romania
-
 Rwanda
-
 Saudi Arabia
-
 Serbia
-
 Singapore
-
 Slovakia
-
 Slovenia
-
 Somalia
-
 South Africa
-
 Spain
Spain
-
 Sri Lanka
-
 Sweden
-
 Switzerland
-
 Syria
Syria
-
 Taiwan
-
 Tajikistan
-
 Tanzania
-
 Thailand
-
 Trinidad and Tobago
-
 Tunisia
-
 Turkey
-
 UAE
UAE
-
 Uganda
-
 Ukraine
-
 United Kingdom
-
United States
-
 Uruguay
-
 Uzbekistan
-
 Venezuela
-
 Vietnam
-
 Yemen
Yemen
-
 Zambia
-
 Zimbabwe
- Forex
- Crypto
