
WLFI slips toward $0.124 as structural breakdown deepens bearish trend

World Liberty Financial is trading under mounting pressure on Thursday as its technical structure continues to deteriorate following a failed attempt to stabilize above recent support zones. Price is hovering near $0.124, pressing the lower end of its short-term range after a decisive breakdown that has shifted the market from consolidation into a sustained bearish phase.
Highlights
- World Liberty Financial trades near $0.124 after breaking below key EMAs.
- The $0.14 to $0.145 zone has flipped into firm overhead supply.
- Persistent net outflows and weak momentum keep downside risks elevated.
While volatility has increased, the decline has remained orderly, suggesting distribution rather than capitulation is driving the move. The weakness reflects a convergence of technical damage, collapsing momentum, and persistent spot outflows. Together, these factors indicate that sellers retain firm control, with little evidence yet that buyers are prepared to defend prior value areas.
4-hour chart confirms transition into sustained downtrend
On the 4-hour chart, the shift in trend is clearly defined. The initial loss of momentum occurred when WLFI broke below its 20-EMA and 50-EMA earlier in the week, signaling that short-term buyers were stepping aside. The more consequential development followed as price slipped beneath the 100-EMA and failed to stabilize, confirming a broader breakdown rather than a temporary pullback.
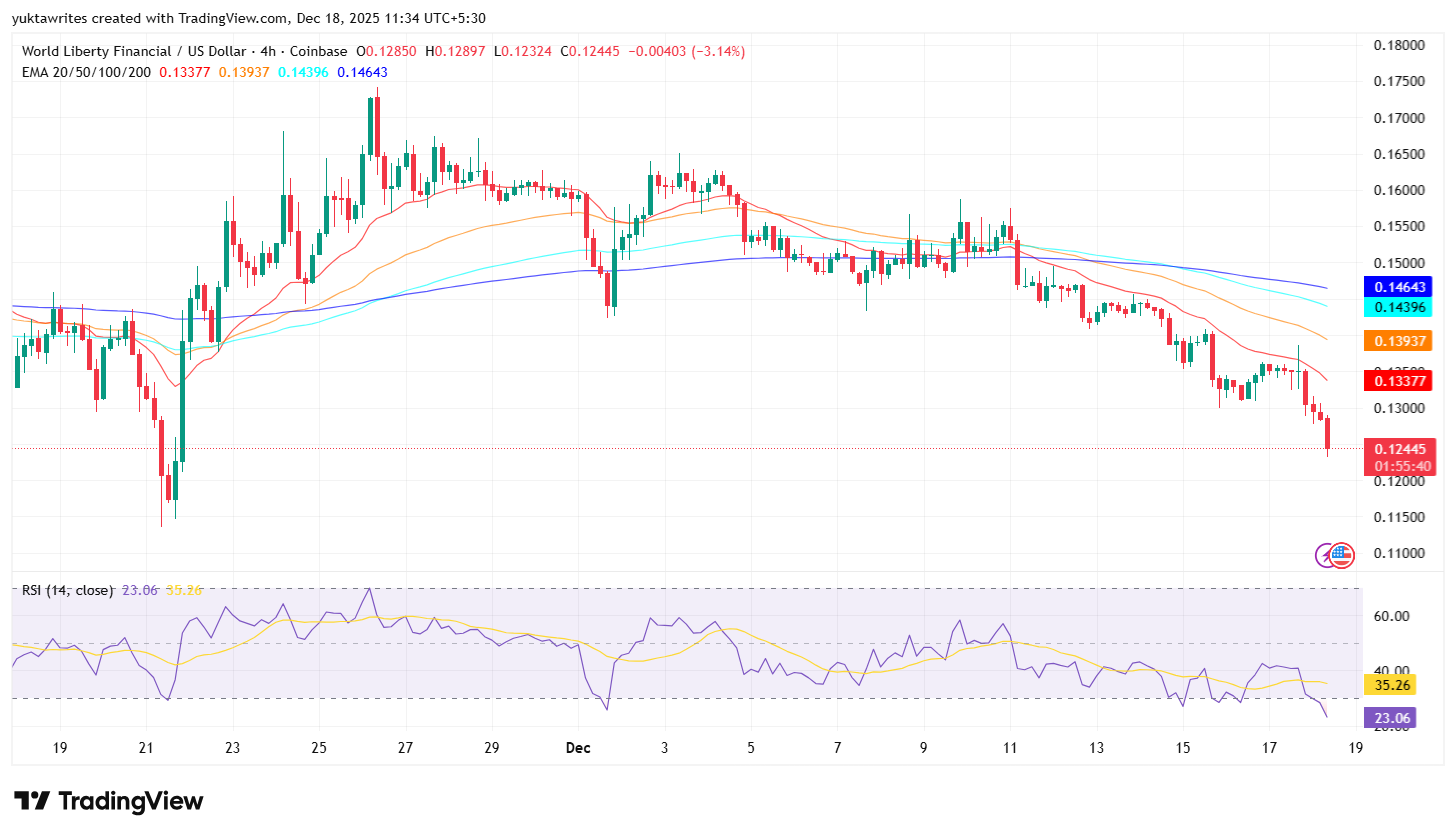
WLFI price dynamics (Source: TradingView)
The longer-term structure has also weakened materially. The 200-EMA is now positioned near the mid-$0.14 area and has begun to slope lower, underscoring that the broader trend bias has turned decisively bearish. Price remains compressed beneath all key averages, with rebounds capped at progressively lower levels.
The $0.14 to $0.145 region now stands out as firm overhead resistance. What previously served as a consolidation zone has transitioned into supply, with each rebound attempt into that area met by renewed selling. Earlier efforts to stabilize near $0.15 failed repeatedly, reinforcing the view that longer-term participants are reducing exposure into strength rather than accumulating.
The recent break below $0.13 marked a structural failure rather than routine volatility. That move exposed the market to deeper retracement risk, with limited historical support beneath current levels.
Momentum and intraday structure remain decisively bearish
Momentum indicators confirm the depth of the weakness. On the 4-hour timeframe, RSI has dropped into the low-20s, reflecting extreme downside pressure and a lack of meaningful bid support. While such readings can sometimes precede short-term bounces, the absence of bullish divergence suggests momentum exhaustion has not yet translated into accumulation.
Instead, RSI behavior points to trend continuation, with selling pressure remaining persistent rather than climactic. This profile is typical of markets undergoing distribution rather than forming durable bases.
Short-term price action reinforces this assessment. On the 30-minute chart, both Supertrend and Parabolic SAR remain firmly positioned above price, keeping intraday bias decisively bearish. Attempts to rebound have been shallow and quickly rejected, with WLFI failing to reclaim even minor resistance near $0.13.
The most recent breakdown unfolded with little hesitation, indicating that sellers are pressing the trend lower without needing aggressive volume. This lack of demand on rebounds suggests buyers remain sidelined rather than preparing to step in.
Spot flows reinforce distribution narrative
Spot flow data adds further downside context. World Liberty Financial has recorded consistent net outflows, with tokens moving onto exchanges at a steady pace. The most recent readings continue to show negative netflow, aligning closely with the sharp deterioration in price.
This behavior suggests ongoing distribution rather than capitulation. Holders appear willing to exit into weakness rather than absorb supply at current levels, reinforcing the bearish technical picture. While brief pauses in selling have emerged, they have not been accompanied by sustained inflows that would signal accumulation.
The alignment between price weakness and negative spot flows increases downside risk, particularly given the lack of structural support beneath current levels.
Market outlook
From a technical perspective, the $0.12 area now represents the most immediate support. This level has limited historical significance, and a sustained break below it would expose WLFI to a deeper retracement toward the low-$0.11 region, where the next potential demand pocket may emerge.
On the upside, price would need to reclaim $0.135 and then stabilize above $0.145 to begin neutralizing downside momentum. Without those recoveries, rallies remain corrective and vulnerable to renewed selling.While oversold conditions may generate brief technical bounces, the broader chart suggests the market is still in a distribution phase rather than base formation. For now, price action favors caution, with the burden of proof resting squarely on any attempt at recovery.
Previously, we highlighted WLFI’s vulnerability once it failed to hold above its key moving averages and continued to see spot outflows persist. The latest breakdown confirms that assessment. Trend, momentum, and flow data remain firmly aligned to the downside.


Latest WLFI News


-
 Afghanistan
-
 Albania
-
 Algeria
-
 Angola
-
 Argentina
-
 Armenia
-
 Australia
-
 Austria
-
 Azerbaijan
-
 Bahamas
-
 Bahrain
-
 Bangladesh
-
 Belarus
-
 Belgium
-
 Bolivia
-
 Botswana
-
 Brazil
-
 Brunei
-
 Bulgaria
-
 Cambodia
-
 Cameroon
-
 Canada
-
 Chile
Chile
-
 China
China
-
 Colombia
-
 Congo
Congo
-
 Costa Rica
-
 Cote d'Ivoire
-
 Croatia
-
 Cuba
Cuba
-
 Cyprus
-
 Czechia
-
 DR Congo
-
 Denmark
-
 Dominican Republic
-
 Ecuador
-
 Egypt
Egypt
-
 El Salvador
-
 Estonia
-
 Eswatini
-
 Ethiopia
-
 Finland
-
 France
-
 Georgia
-
 Germany
-
 Ghana
Ghana
-
 Greece
-
 Haiti
Haiti
-
 Hong Kong
-
 Hungary
-
 India
India
-
 Indonesia
-
 Iran, Islamic republic
-
 Iraq
Iraq
-
 Ireland
-
 Israel
-
 Italy
Italy
-
 Jamaica
-
 Japan
Japan
-
 Jordan
-
 Kazakhstan
-
 Kenya
Kenya
-
 Korea
Korea
-
 Kuwait
-
 Kyrgyzstan
-
 Laos
Laos
-
 Latvia
-
 Lebanon
-
 Lesotho
-
 Libya
Libya
-
 Lithuania
-
 Luxembourg
-
 Madagascar
-
 Malaysia
-
 Malta
Malta
-
 Mauritius
-
 Mexico
-
 Moldova
-
 Mongolia
-
 Montenegro
-
 Morocco
-
 Mozambique
-
 Myanmar
-
 Namibia
-
 Nepal
Nepal
-
 Netherlands
-
 New Zealand
-
 Nigeria
-
 North Macedonia
-
 Norway
-
 Oman
Oman
-
 Pakistan
-
 Palestine
-
 Panama
-
 Papua New Guinea
-
 Paraguay
-
 Peru
Peru
-
 Philippines
-
 Poland
-
 Portugal
-
 Puerto Rico
-
 Qatar
Qatar
-
 Reunion
-
 Romania
-
 Rwanda
-
 Saudi Arabia
-
 Serbia
-
 Singapore
-
 Slovakia
-
 Slovenia
-
 Somalia
-
 South Africa
-
 Spain
Spain
-
 Sri Lanka
-
 Sweden
-
 Switzerland
-
 Syria
Syria
-
 Taiwan
-
 Tajikistan
-
 Tanzania
-
 Thailand
-
 Trinidad and Tobago
-
 Tunisia
-
 Turkey
-
 UAE
UAE
-
 Uganda
-
 Ukraine
-
 United Kingdom
-
United States
-
 Uruguay
-
 Uzbekistan
-
 Venezuela
-
 Vietnam
-
 Yemen
Yemen
-
 Zambia
-
 Zimbabwe
- Forex
- Crypto
