
Trump trades flat as sellers dominate and technical reversal fails to emerge

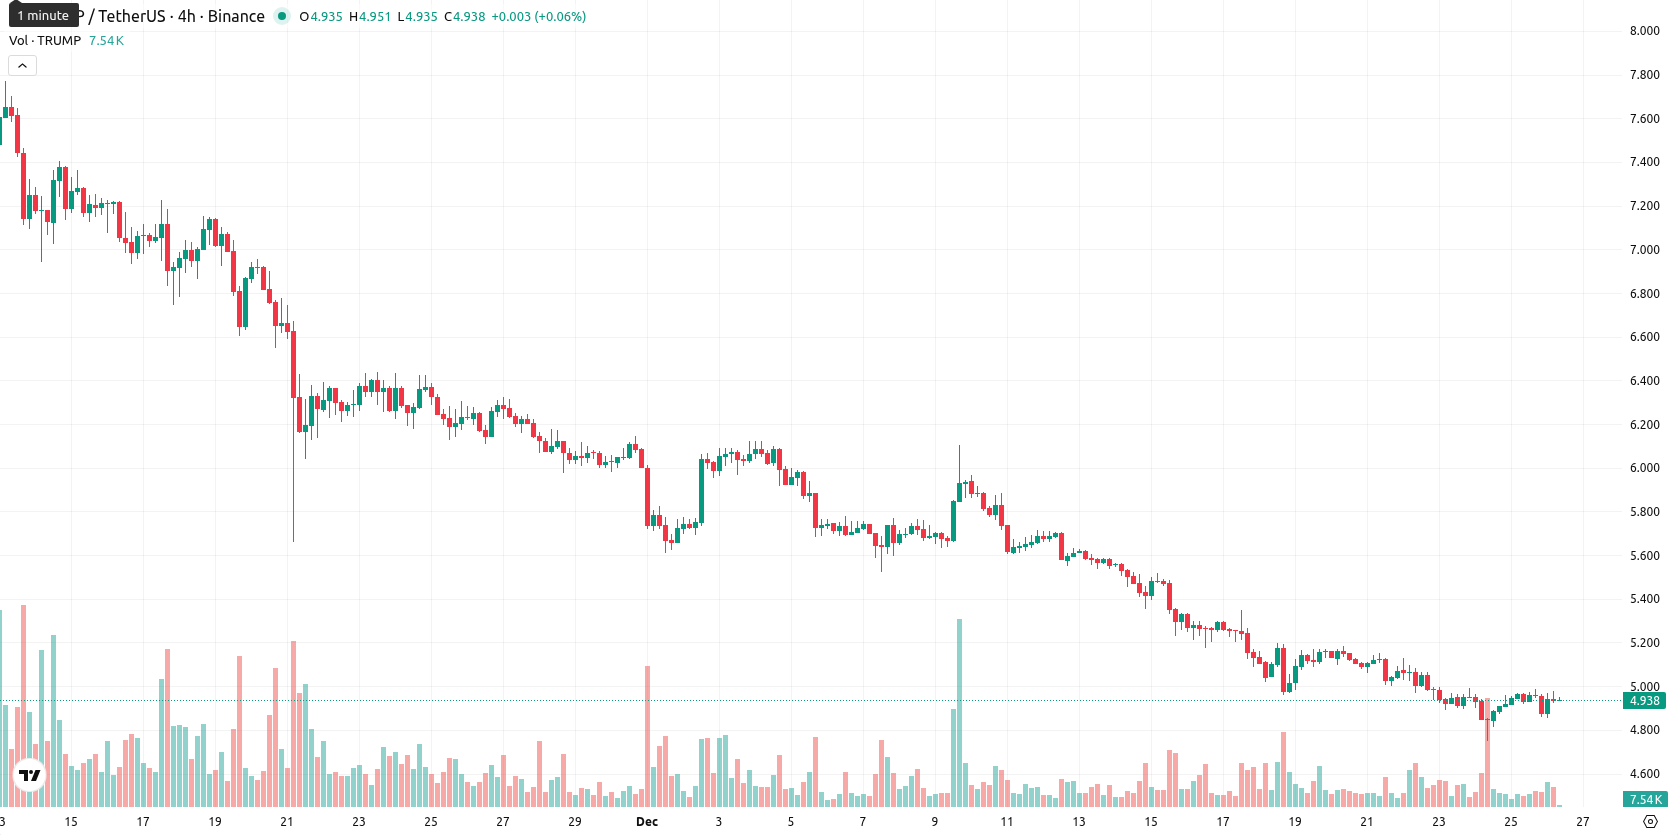
Official Trump (TRUMP) is trading at $4.95, unchanged from the previous close. The asset remains well below the MA-20 ($5.34), MA-50 ($6.19), and MA-200 ($7.94), reinforcing persistent bearish pressure on all major timeframes.
Highlights
- TRUMP trades at $4.95, well below MA-20 ($5.34), MA-50 ($6.19), and MA-200 ($7.94), signaling persistent bearish pressure across all timeframes.
- Momentum indicators—MACD (strong sell), RSI (27.75), and CCI (–98.63)—confirm oversold conditions without reversal signals, pointing to continued downside risk.
- Trading is expected to consolidate between $4.70 and $5.30 over the next five days, with less than 20% probability of a price increase and bearish bias prevailing.
Oversold momentum and support test constrain price within tight range
Near-term support is defined by the recent $4.85 intraday low, while resistance is overhead at the Ichimoku Kijun level of $5.46. Momentum indicators, including MACD and ADX, continue to signal downside strength, and oscillators such as RSI (27.75), Stoch RSI (4.72), and CCI (–98.63) show deeply oversold conditions without immediate signs of reversal. BBP points to continued dominance by sellers, and the Awesome Oscillator remains neutral, neither confirming nor challenging current momentum. Trading is mostly confined to a moderate volatility range between $4.85 and $4.98, with price action clustered near the higher end of this band.
Limited recovery prospects as bears maintain control over short term
For the next five trading days, the typical volatility band is expected between $4.70 and $5.30, as momentum works off oversold conditions but bears retain firm control. The probability of a price recovery is very low (below 20%), while the risk of further decline remains pronounced. Price consolidation is the baseline scenario unless a close above $5.46 resistance prompts a technical shift. A move below $4.70 would confirm a renewed bearish phase and increase downside risk.
Previously it was reported that Official Trump (TRUMP) trades well below major moving averages with persistent bearish momentum, as signaled by negative MACD and ADX readings. Despite oversold conditions indicated by RSI and other oscillators, further declines are likely unless resistance at $5.46 is broken, with the asset expected to consolidate within the $4.50 – $5.40 range.


-
 Afghanistan
-
 Albania
-
 Algeria
-
 Angola
-
 Argentina
-
 Armenia
-
 Australia
-
 Austria
-
 Azerbaijan
-
 Bahamas
-
 Bahrain
-
 Bangladesh
-
 Belarus
-
 Belgium
-
 Bolivia
-
 Botswana
-
 Brazil
-
 Brunei
-
 Bulgaria
-
 Cambodia
-
 Cameroon
-
 Canada
-
 Chile
Chile
-
 China
China
-
 Colombia
-
 Congo
Congo
-
 Costa Rica
-
 Cote d'Ivoire
-
 Croatia
-
 Cuba
Cuba
-
 Cyprus
-
 Czechia
-
 DR Congo
-
 Denmark
-
 Dominican Republic
-
 Ecuador
-
 Egypt
Egypt
-
 El Salvador
-
 Estonia
-
 Eswatini
-
 Ethiopia
-
 Finland
-
 France
-
 Georgia
-
 Germany
-
 Ghana
Ghana
-
 Greece
-
 Haiti
Haiti
-
 Hong Kong
-
 Hungary
-
 India
India
-
 Indonesia
-
 Iran, Islamic republic
-
 Iraq
Iraq
-
 Ireland
-
 Israel
-
 Italy
Italy
-
 Jamaica
-
 Japan
Japan
-
 Jordan
-
 Kazakhstan
-
 Kenya
Kenya
-
 Korea
Korea
-
 Kuwait
-
 Kyrgyzstan
-
 Laos
Laos
-
 Latvia
-
 Lebanon
-
 Lesotho
-
 Libya
Libya
-
 Lithuania
-
 Luxembourg
-
 Madagascar
-
 Malaysia
-
 Malta
Malta
-
 Mauritius
-
 Mexico
-
 Moldova
-
 Mongolia
-
 Montenegro
-
 Morocco
-
 Mozambique
-
 Myanmar
-
 Namibia
-
 Nepal
Nepal
-
 Netherlands
-
 New Zealand
-
 Nigeria
-
 North Macedonia
-
 Norway
-
 Oman
Oman
-
 Pakistan
-
 Palestine
-
 Panama
-
 Papua New Guinea
-
 Paraguay
-
 Peru
Peru
-
 Philippines
-
 Poland
-
 Portugal
-
 Puerto Rico
-
 Qatar
Qatar
-
 Reunion
-
 Romania
-
 Rwanda
-
 Saudi Arabia
-
 Serbia
-
 Singapore
-
 Slovakia
-
 Slovenia
-
 Somalia
-
 South Africa
-
 Spain
Spain
-
 Sri Lanka
-
 Sweden
-
 Switzerland
-
 Syria
Syria
-
 Taiwan
-
 Tajikistan
-
 Tanzania
-
 Thailand
-
 Trinidad and Tobago
-
 Tunisia
-
 Turkey
-
 UAE
UAE
-
 Uganda
-
 Ukraine
-
 United Kingdom
-
United States
-
 Uruguay
-
 Uzbekistan
-
 Venezuela
-
 Vietnam
-
 Yemen
Yemen
-
 Zambia
-
 Zimbabwe
- Forex
- Crypto
