
Pepe price prediction: Will downside persist? PEPE sees muted action

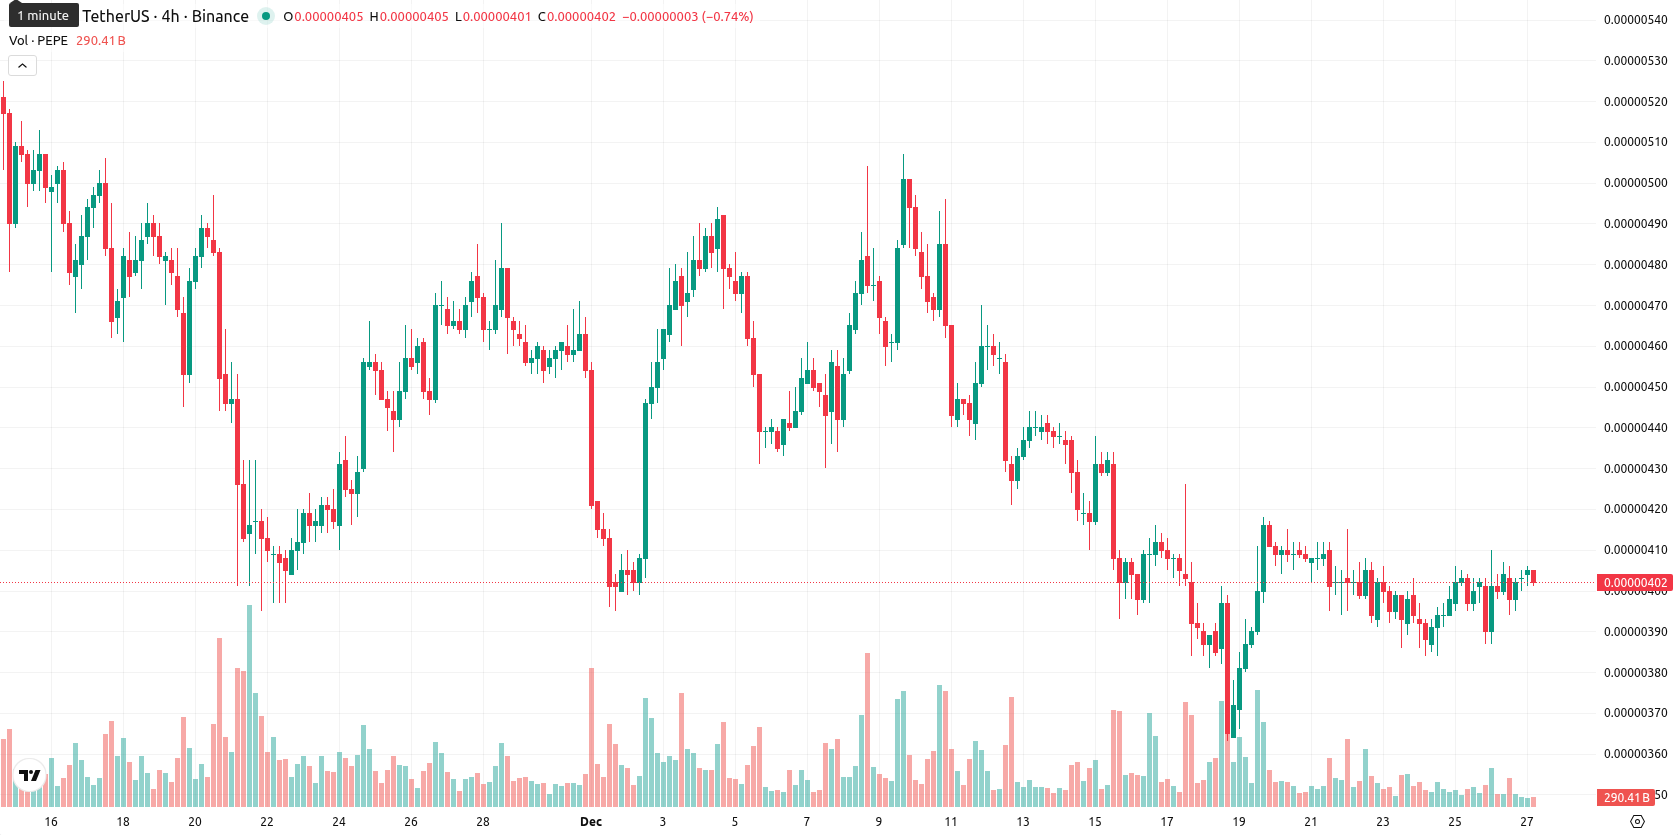
Pepe (PEPE) is trading at $0.0000040, positioned just below the MA-20 ($0.00000421), MA-50 ($0.00000462), and well under the MA-200 ($0.00000868). This setup highlights persistent selling pressure across the short-, medium-, and long-term timeframes.
Highlights
- PEPE trades at $0.0000040, remaining below the MA-20 ($0.00000421), MA-50 ($0.00000462), and MA-200 ($0.00000868), signaling persistent bearish pressure across timeframes.
- Bearish momentum dominates as MACD gives a strong sell, ADX on D1 confirms a downtrend, and RSI at 42.6 stays in the sell zone.
- Next five days likely see PEPE ranging between $0.00000388 and $0.00000418, with sub-20 percent probability of price increase and further declines more likely.
Bearish momentum persists as technical signals diverge intraday
Momentum indicators remain bearish, with MACD signaling strong selling momentum and the ADX on the daily chart confirming a prevailing downtrend. The Relative Strength Index (RSI) stands at 42.6 alongside a bearish CCI readout, while Stoch RSI in the overbought zone hints at a potential short-term reversal. BBP highlights slight intraday buyer advantage, although this is at odds with other momentum metrics. The price is trading at the lower end of a narrow daily range ($0.0000040 – $0.0000041) without any gap at the open, suggesting low volatility and a continuation of downside bias, as also indicated by the Awesome Oscillator.
Sideways price risk as breakout probabilities remain subdued
Over the coming five sessions, PEPE is likely to remain confined to a typical volatility band between $0.00000388 and $0.00000418, with less than a 20% chance of a sustained move higher. The base case points to sideways price action within this narrow corridor. A bullish breakout above resistance at $0.00000435 could trigger a climb toward the upper end of the range, while a breach below $0.00000388 would reinforce the ongoing downward pressure.
Previously it was reported that Pepe remains under pressure, trading below key moving averages across all timeframes, with technical indicators such as MACD, ADX, and RSI signaling persistent bearish momentum. The asset is consolidating just below dynamic resistance with limited volatility and a higher probability of further downside unless a breakout above resistance materializes.


Latest PEPE/USD News


-
 Afghanistan
-
 Albania
-
 Algeria
-
 Angola
-
 Argentina
-
 Armenia
-
 Australia
-
 Austria
-
 Azerbaijan
-
 Bahamas
-
 Bahrain
-
 Bangladesh
-
 Belarus
-
 Belgium
-
 Bolivia
-
 Botswana
-
 Brazil
-
 Brunei
-
 Bulgaria
-
 Cambodia
-
 Cameroon
-
 Canada
-
 Chile
Chile
-
 China
China
-
 Colombia
-
 Congo
Congo
-
 Costa Rica
-
 Cote d'Ivoire
-
 Croatia
-
 Cuba
Cuba
-
 Cyprus
-
 Czechia
-
 DR Congo
-
 Denmark
-
 Dominican Republic
-
 Ecuador
-
 Egypt
Egypt
-
 El Salvador
-
 Estonia
-
 Eswatini
-
 Ethiopia
-
 Finland
-
 France
-
 Georgia
-
 Germany
-
 Ghana
Ghana
-
 Greece
-
 Haiti
Haiti
-
 Hong Kong
-
 Hungary
-
 India
India
-
 Indonesia
-
 Iran, Islamic republic
-
 Iraq
Iraq
-
 Ireland
-
 Israel
-
 Italy
Italy
-
 Jamaica
-
 Japan
Japan
-
 Jordan
-
 Kazakhstan
-
 Kenya
Kenya
-
 Korea
Korea
-
 Kuwait
-
 Kyrgyzstan
-
 Laos
Laos
-
 Latvia
-
 Lebanon
-
 Lesotho
-
 Libya
Libya
-
 Lithuania
-
 Luxembourg
-
 Madagascar
-
 Malaysia
-
 Malta
Malta
-
 Mauritius
-
 Mexico
-
 Moldova
-
 Mongolia
-
 Montenegro
-
 Morocco
-
 Mozambique
-
 Myanmar
-
 Namibia
-
 Nepal
Nepal
-
 Netherlands
-
 New Zealand
-
 Nigeria
-
 North Macedonia
-
 Norway
-
 Oman
Oman
-
 Pakistan
-
 Palestine
-
 Panama
-
 Papua New Guinea
-
 Paraguay
-
 Peru
Peru
-
 Philippines
-
 Poland
-
 Portugal
-
 Puerto Rico
-
 Qatar
Qatar
-
 Reunion
-
 Romania
-
 Rwanda
-
 Saudi Arabia
-
 Serbia
-
 Singapore
-
 Slovakia
-
 Slovenia
-
 Somalia
-
 South Africa
-
 Spain
Spain
-
 Sri Lanka
-
 Sweden
-
 Switzerland
-
 Syria
Syria
-
 Taiwan
-
 Tajikistan
-
 Tanzania
-
 Thailand
-
 Trinidad and Tobago
-
 Tunisia
-
 Turkey
-
 UAE
UAE
-
 Uganda
-
 Ukraine
-
 United Kingdom
-
United States
-
 Uruguay
-
 Uzbekistan
-
 Venezuela
-
 Vietnam
-
 Yemen
Yemen
-
 Zambia
-
 Zimbabwe
- Forex
- Crypto
