
Raydium price prediction: Bearish odds for RAY despite brief rally?

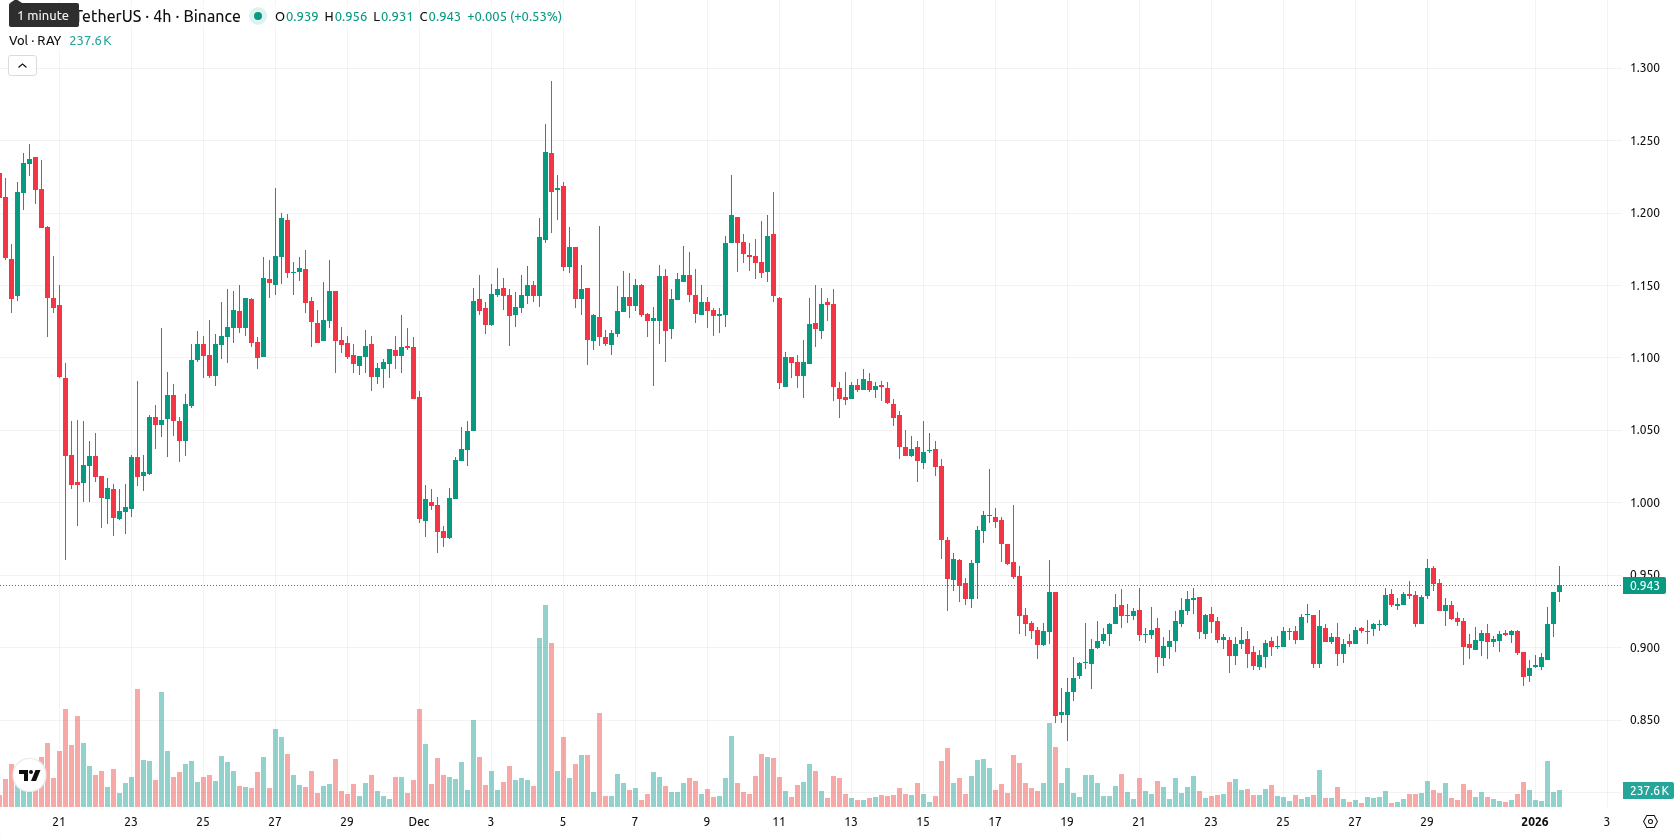
Raydium (RAY) is trading at $0.953, having gained $0.064 or 7.2% on the day. The price stands above the MA-20 ($0.9371) but remains below the MA-50 ($1.0738) and well under the MA-200 ($2.2429), highlighting ongoing medium- and long-term bearish trends despite some near-term upward momentum.
Highlights
- RAY trades at $0.953, above the MA-20 ($0.9371) but below MA-50 ($1.0738) and MA-200 ($2.2429), indicating persistent medium- and long-term bearish trends despite recent gains.
- Today's price surged 7.2% ($0.064) to near the session high, but daily momentum indicators (MACD, ADX, BBP) remain bearish and signal dominant seller control.
- For the next five trading days, RAY is expected to range between $0.86 and $0.99, with less than a 20% chance of further upside and a higher likelihood of downward movement.
Bearish signals persist as intraday strength diverges from daily momentum
The nearest dynamic resistance for RAY is at the Ichimoku Kijun level ($1.0305), with short-term support just above MA-20, suggesting that sellers still dominate unless the price sustains above these barriers. Momentum signals on the daily frame are mixed: MACD gives a strong sell while ADX reflects persistent but possibly waning selling strength. RSI and CCI display mild oversold conditions, and Stoch RSI is neutral on the day but overbought on intraday timeframes, indicating stretched short-term buying. BBP holds a negative value, confirming sellers continue to dominate, yet the Awesome Oscillator remains neutral and does not strongly support the rally. Today’s move placed the price near the session high, reflecting elevated volatility and strength toward highs; however, the divergence between short-term bullish intraday action and overall bearish daily momentum signals a risk of reversal if follow-through weakens.
Downside risk dominates as sellers press within defined volatility range
For the next five trading days, RAY is expected to fluctuate within a typical volatility band between $0.86 and $0.99. The probability of further upward movement is very low (less than 20%), making a downward scenario much more likely. In the baseline case, RAY may consolidate between short-term support and resistance as sellers maintain pressure. A bullish turn requires a clear break and hold above the $1.03 resistance area, while a bearish scenario would see the price dip below $0.86 and test lower supports.
Last time, analysts noted that Raydium (RAY) continues to trade well below its key moving averages, with bearish momentum indicators such as MACD, ADX, and a low RSI pointing to sustained downside pressure despite a modest intraday rebound. Resistance is identified near $1.398, while support sits above $1.08, and the asset is expected to consolidate within a limited range amid prevailing negative technical signals.


Latest Raydium News


-
 Afghanistan
-
 Albania
-
 Algeria
-
 Angola
-
 Argentina
-
 Armenia
-
 Australia
-
 Austria
-
 Azerbaijan
-
 Bahamas
-
 Bahrain
-
 Bangladesh
-
 Belarus
-
 Belgium
-
 Bolivia
-
 Botswana
-
 Brazil
-
 Brunei
-
 Bulgaria
-
 Cambodia
-
 Cameroon
-
 Canada
-
 Chile
Chile
-
 China
China
-
 Colombia
-
 Congo
Congo
-
 Costa Rica
-
 Cote d'Ivoire
-
 Croatia
-
 Cuba
Cuba
-
 Cyprus
-
 Czechia
-
 DR Congo
-
 Denmark
-
 Dominican Republic
-
 Ecuador
-
 Egypt
Egypt
-
 El Salvador
-
 Estonia
-
 Eswatini
-
 Ethiopia
-
 Finland
-
 France
-
 Georgia
-
 Germany
-
 Ghana
Ghana
-
 Greece
-
 Haiti
Haiti
-
 Hong Kong
-
 Hungary
-
 India
India
-
 Indonesia
-
 Iran, Islamic republic
-
 Iraq
Iraq
-
 Ireland
-
 Israel
-
 Italy
Italy
-
 Jamaica
-
 Japan
Japan
-
 Jordan
-
 Kazakhstan
-
 Kenya
Kenya
-
 Korea
Korea
-
 Kuwait
-
 Kyrgyzstan
-
 Laos
Laos
-
 Latvia
-
 Lebanon
-
 Lesotho
-
 Libya
Libya
-
 Lithuania
-
 Luxembourg
-
 Madagascar
-
 Malaysia
-
 Malta
Malta
-
 Mauritius
-
 Mexico
-
 Moldova
-
 Mongolia
-
 Montenegro
-
 Morocco
-
 Mozambique
-
 Myanmar
-
 Namibia
-
 Nepal
Nepal
-
 Netherlands
-
 New Zealand
-
 Nigeria
-
 North Macedonia
-
 Norway
-
 Oman
Oman
-
 Pakistan
-
 Palestine
-
 Panama
-
 Papua New Guinea
-
 Paraguay
-
 Peru
Peru
-
 Philippines
-
 Poland
-
 Portugal
-
 Puerto Rico
-
 Qatar
Qatar
-
 Reunion
-
 Romania
-
 Rwanda
-
 Saudi Arabia
-
 Serbia
-
 Singapore
-
 Slovakia
-
 Slovenia
-
 Somalia
-
 South Africa
-
 Spain
Spain
-
 Sri Lanka
-
 Sweden
-
 Switzerland
-
 Syria
Syria
-
 Taiwan
-
 Tajikistan
-
 Tanzania
-
 Thailand
-
 Trinidad and Tobago
-
 Tunisia
-
 Turkey
-
 UAE
UAE
-
 Uganda
-
 Ukraine
-
 United Kingdom
-
United States
-
 Uruguay
-
 Uzbekistan
-
 Venezuela
-
 Vietnam
-
 Yemen
Yemen
-
 Zambia
-
 Zimbabwe
- Forex
- Crypto
