
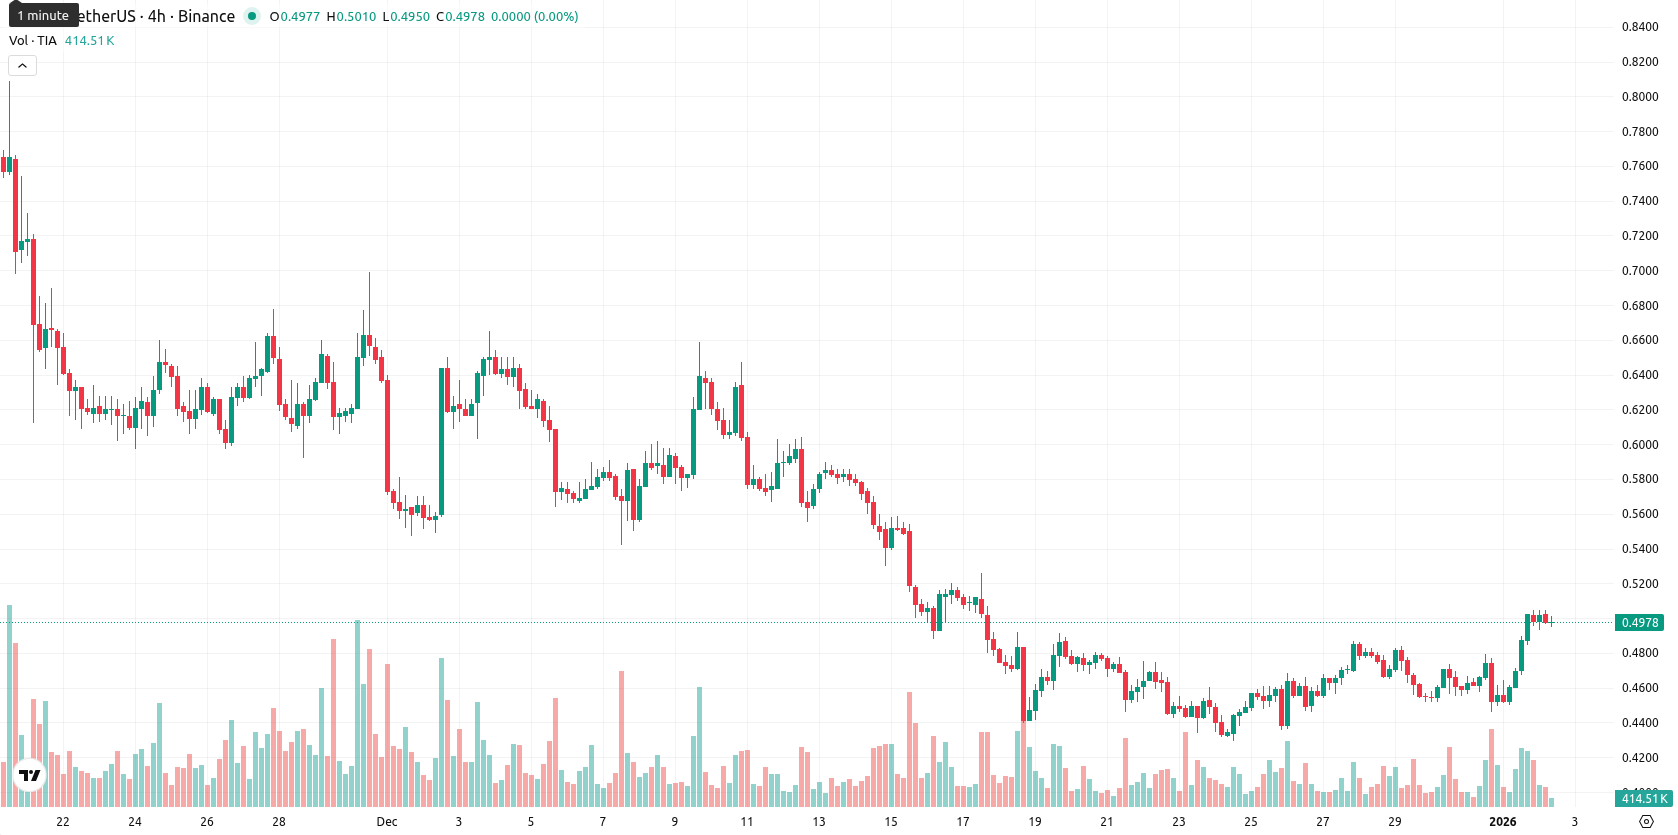
Celestia jumps 9.25% as intraday bulls drive price toward resistance amidst mixed signals

Celestia (TIA) is trading at $0.5019, positioned above the MA-20 ($0.4774) but below the MA-50 ($0.5909) and well beneath the MA-200 ($1,2952). This setup suggests short-term buying strength, ongoing medium-term resistance, and continued long-term bearish pressure, with the nearest dynamic resistance at the Ichimoku Kijun level ($0.5441) and support near the MA-20.
Highlights
- Celestia's 24-hour trading volume climbed to $30.21 million, indicating increased market activity and heightened investor engagement.
- The asset is recovering gradually among mid-cap crypto tokens, but no major regulatory actions or ecosystem events have occurred recently.
- Market sentiment appears neutral as the price recovery is not driven by significant external developments or news catalysts.
Trading volume surge as recovery continues without major news
Market activity for Celestia has increased, with 24-hour trading volume reaching $30.21 million, reflecting heightened engagement. The asset remains among mid-cap crypto tokens showing gradual recovery. No significant regulatory actions or ecosystem events have been reported recently.
Momentum divergence as buyers push into overbought conditions
Momentum signals are mixed: the MACD on D1 remains in strong sell territory while the ADX shows a sell bias but with moderate trend strength. The RSI reads 46.8 (mildly bearish), Stoch RSI is fully overbought (100), and CCI is neutral, hinting at possible exhaustion after a strong move. Bull/Bear Power (BBP) indicates buyers currently dominate intraday momentum, with the Awesome Oscillator staying neutral. The daily move was strong, up 9.25% ($0.0425) with a clear gap higher at today’s open ($0.4988 vs. $0.4594), and the price sits near today’s high ($0.5045), reflecting high intraday volatility and sustained upward pressure after the open. Despite strong buyer tone, the overbought oscillators and bearish MACD signal a notable divergence, warning that momentum could falter if buying interest wanes.
Sideways bias likely amid strong resistance and weak upward odds
For the next five trading days, a typical volatility band of $0.4650 – $0.5200 is expected, centering the forecast around current levels and recent price fluctuations. The probability of a further price increase remains low (less than 20%), making sideways movement or a pullback more likely, based on the consistently bearish signals from weekly momentum and trend indicators. The baseline scenario is for TIA to consolidate within $0.4650 – $0.5200, while a bullish reversal would require a breakout above $0.5440 resistance. A bearish scenario could develop if price drops below $0.4770 support, opening potential for further downside.
Last time, analysts noted that Celestia (TIA) showed a short-term bullish rebound above its 20-day moving average, though it remains under pressure from sellers with the price still below key 50- and 200-day averages. Momentum signals are mixed, with resistance seen at the Kijun line, weak MACD and ADX readings, and an oversold RSI being offset by increased trading volume and near-term buyer strength.


Latest Celestia News


-
 Afghanistan
-
 Albania
-
 Algeria
-
 Angola
-
 Argentina
-
 Armenia
-
 Australia
-
 Austria
-
 Azerbaijan
-
 Bahamas
-
 Bahrain
-
 Bangladesh
-
 Belarus
-
 Belgium
-
 Bolivia
-
 Botswana
-
 Brazil
-
 Brunei
-
 Bulgaria
-
 Cambodia
-
 Cameroon
-
 Canada
-
 Chile
Chile
-
 China
China
-
 Colombia
-
 Congo
Congo
-
 Costa Rica
-
 Cote d'Ivoire
-
 Croatia
-
 Cuba
Cuba
-
 Cyprus
-
 Czechia
-
 DR Congo
-
 Denmark
-
 Dominican Republic
-
 Ecuador
-
 Egypt
Egypt
-
 El Salvador
-
 Estonia
-
 Eswatini
-
 Ethiopia
-
 Finland
-
 France
-
 Georgia
-
 Germany
-
 Ghana
Ghana
-
 Greece
-
 Haiti
Haiti
-
 Hong Kong
-
 Hungary
-
 India
India
-
 Indonesia
-
 Iran, Islamic republic
-
 Iraq
Iraq
-
 Ireland
-
 Israel
-
 Italy
Italy
-
 Jamaica
-
 Japan
Japan
-
 Jordan
-
 Kazakhstan
-
 Kenya
Kenya
-
 Korea
Korea
-
 Kuwait
-
 Kyrgyzstan
-
 Laos
Laos
-
 Latvia
-
 Lebanon
-
 Lesotho
-
 Libya
Libya
-
 Lithuania
-
 Luxembourg
-
 Madagascar
-
 Malaysia
-
 Malta
Malta
-
 Mauritius
-
 Mexico
-
 Moldova
-
 Mongolia
-
 Montenegro
-
 Morocco
-
 Mozambique
-
 Myanmar
-
 Namibia
-
 Nepal
Nepal
-
 Netherlands
-
 New Zealand
-
 Nigeria
-
 North Macedonia
-
 Norway
-
 Oman
Oman
-
 Pakistan
-
 Palestine
-
 Panama
-
 Papua New Guinea
-
 Paraguay
-
 Peru
Peru
-
 Philippines
-
 Poland
-
 Portugal
-
 Puerto Rico
-
 Qatar
Qatar
-
 Reunion
-
 Romania
-
 Rwanda
-
 Saudi Arabia
-
 Serbia
-
 Singapore
-
 Slovakia
-
 Slovenia
-
 Somalia
-
 South Africa
-
 Spain
Spain
-
 Sri Lanka
-
 Sweden
-
 Switzerland
-
 Syria
Syria
-
 Taiwan
-
 Tajikistan
-
 Tanzania
-
 Thailand
-
 Trinidad and Tobago
-
 Tunisia
-
 Turkey
-
 UAE
UAE
-
 Uganda
-
 Ukraine
-
 United Kingdom
-
United States
-
 Uruguay
-
 Uzbekistan
-
 Venezuela
-
 Vietnam
-
 Yemen
Yemen
-
 Zambia
-
 Zimbabwe
- Forex
- Crypto
