
TRUMP price prediction: Can short-term buyers lift the price? TRUMP gains 3.17%

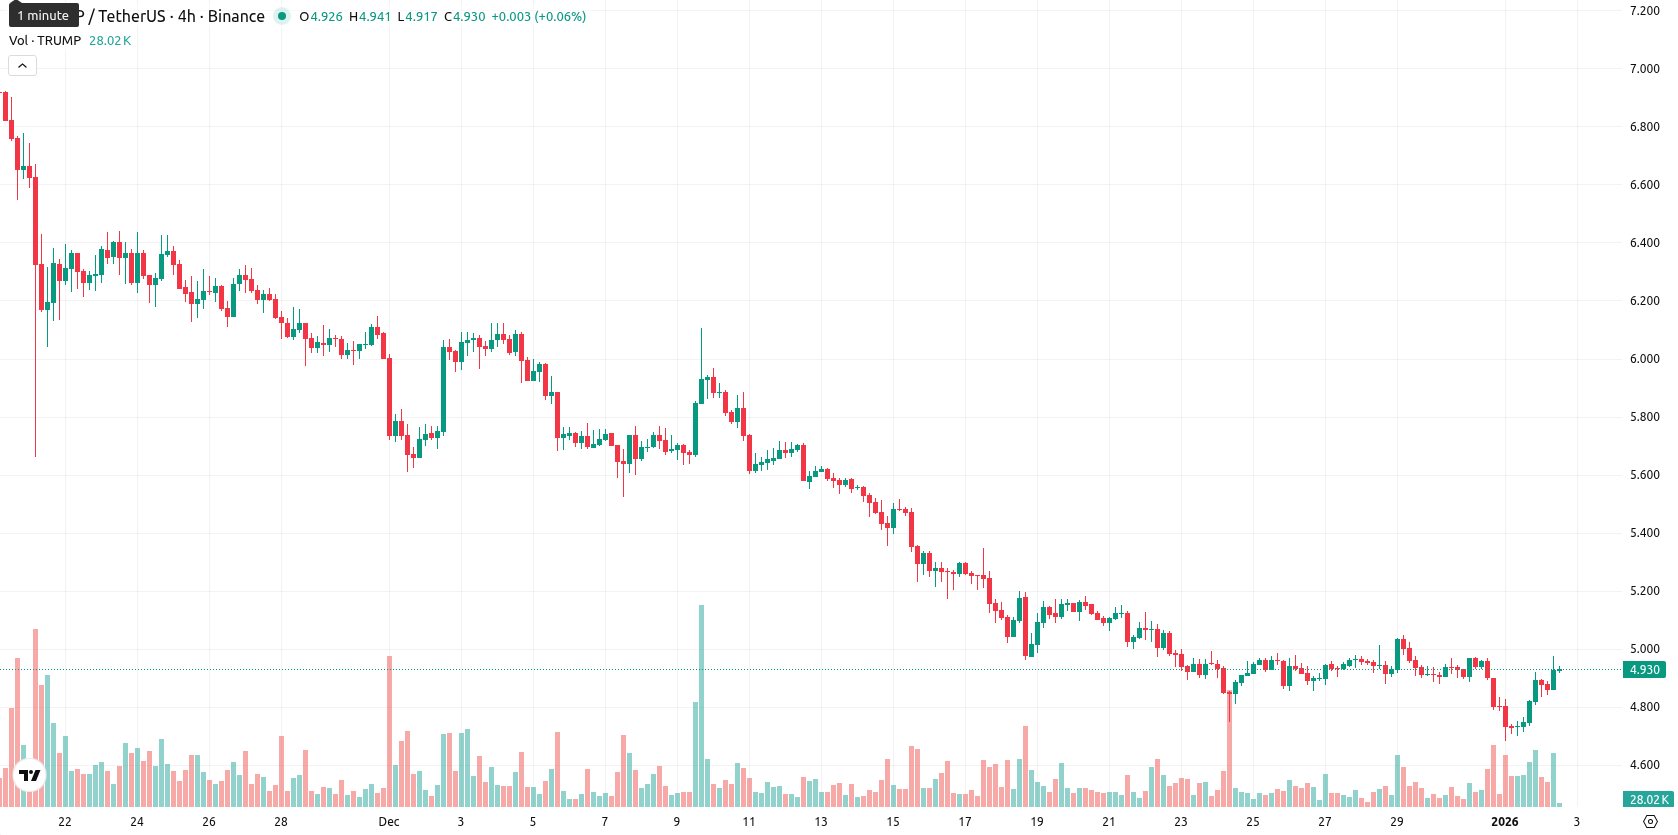
Official Trump (TRUMP) is trading at $4.88, which is below the MA-20 ($5.06), MA-50 ($5.78), and MA-200 ($7.74), reflecting continued pressure from sellers across short-, medium-, and long-term timeframes. The nearest dynamic resistance is the Ichimoku Kijun at $5.39, while there is no strong support from the moving averages in the current range.
Highlights
- TRUMP trades at $4.88, consistently below MA-20 ($5.06), MA-50 ($5.78), and MA-200 ($7.74), confirming bearish pressure across all timeframes.
- Daily technicals show strong sell momentum with MACD and ADX both negative, while oscillators suggest weak momentum and uncertain short-term exhaustion.
- TRUMP is likely to consolidate between $4.42 and $4.95 over the next week, with less than 20 probability for a sustained price increase.
Bearish momentum diverges from brief intraday buying strength
Momentum readings show a negative outlook, with both the MACD (strong sell) and ADX (sell) on the daily chart confirming bearish momentum. Oscillators such as RSI (34.13, sell), Stoch RSI (overbought), and CCI (sell) present mixed signals — momentum appears weak, but short-term exhaustion from oversold readings is not yet clear, as Stoch RSI and CCI suggest temporary overbought conditions. Bull/Bear Power remains negative, indicating sellers are dominant intraday. The Awesome Oscillator is neutral and does not reinforce the prevailing trend. After a minor gap up at today’s open ($4.89 vs. prior close $4.73), the current price sits near the top of the session’s tight range ($4.83 – $4.90), suggesting moderate intraday volatility and some buying strength after the open. There is a clear divergence between bearish momentum signals and the short-term lift seen after the open.
Sideways bias as upside risk remains limited
The expected price range for TRUMP over the next week is adjusted to $4.42 – $4.95 to reflect a typical volatility band relative to current levels. There is a very low probability (less than 20%) of a sustained price increase this week, making a downside move more likely. The baseline scenario is for the price to consolidate sideways between $4.42 and $4.95. A bullish scenario would require the price to break decisively above $4.95 and the Kijun resistance at $5.39, which appears unlikely given the current signals, while a close below $4.42 would open the door for further declines in the short term.
Last time, analysts noted that Official Trump remained under sustained bearish pressure, trading below all major moving averages with key indicators such as RSI, MACD, and ADX confirming persistent downside momentum and near-oversold conditions. Immediate resistance is identified at $5.44, with support only marginally higher than current levels, leaving the price likely to remain rangebound amid continued selling.


-
 Afghanistan
-
 Albania
-
 Algeria
-
 Angola
-
 Argentina
-
 Armenia
-
 Australia
-
 Austria
-
 Azerbaijan
-
 Bahamas
-
 Bahrain
-
 Bangladesh
-
 Belarus
-
 Belgium
-
 Bolivia
-
 Botswana
-
 Brazil
-
 Brunei
-
 Bulgaria
-
 Cambodia
-
 Cameroon
-
 Canada
-
 Chile
Chile
-
 China
China
-
 Colombia
-
 Congo
Congo
-
 Costa Rica
-
 Cote d'Ivoire
-
 Croatia
-
 Cuba
Cuba
-
 Cyprus
-
 Czechia
-
 DR Congo
-
 Denmark
-
 Dominican Republic
-
 Ecuador
-
 Egypt
Egypt
-
 El Salvador
-
 Estonia
-
 Eswatini
-
 Ethiopia
-
 Finland
-
 France
-
 Georgia
-
 Germany
-
 Ghana
Ghana
-
 Greece
-
 Haiti
Haiti
-
 Hong Kong
-
 Hungary
-
 India
India
-
 Indonesia
-
 Iran, Islamic republic
-
 Iraq
Iraq
-
 Ireland
-
 Israel
-
 Italy
Italy
-
 Jamaica
-
 Japan
Japan
-
 Jordan
-
 Kazakhstan
-
 Kenya
Kenya
-
 Korea
Korea
-
 Kuwait
-
 Kyrgyzstan
-
 Laos
Laos
-
 Latvia
-
 Lebanon
-
 Lesotho
-
 Libya
Libya
-
 Lithuania
-
 Luxembourg
-
 Madagascar
-
 Malaysia
-
 Malta
Malta
-
 Mauritius
-
 Mexico
-
 Moldova
-
 Mongolia
-
 Montenegro
-
 Morocco
-
 Mozambique
-
 Myanmar
-
 Namibia
-
 Nepal
Nepal
-
 Netherlands
-
 New Zealand
-
 Nigeria
-
 North Macedonia
-
 Norway
-
 Oman
Oman
-
 Pakistan
-
 Palestine
-
 Panama
-
 Papua New Guinea
-
 Paraguay
-
 Peru
Peru
-
 Philippines
-
 Poland
-
 Portugal
-
 Puerto Rico
-
 Qatar
Qatar
-
 Reunion
-
 Romania
-
 Rwanda
-
 Saudi Arabia
-
 Serbia
-
 Singapore
-
 Slovakia
-
 Slovenia
-
 Somalia
-
 South Africa
-
 Spain
Spain
-
 Sri Lanka
-
 Sweden
-
 Switzerland
-
 Syria
Syria
-
 Taiwan
-
 Tajikistan
-
 Tanzania
-
 Thailand
-
 Trinidad and Tobago
-
 Tunisia
-
 Turkey
-
 UAE
UAE
-
 Uganda
-
 Ukraine
-
 United Kingdom
-
United States
-
 Uruguay
-
 Uzbekistan
-
 Venezuela
-
 Vietnam
-
 Yemen
Yemen
-
 Zambia
-
 Zimbabwe
- Forex
- Crypto
