
+7.01% for VeChain — intraday buyers lead rally but uptrend faces hurdles

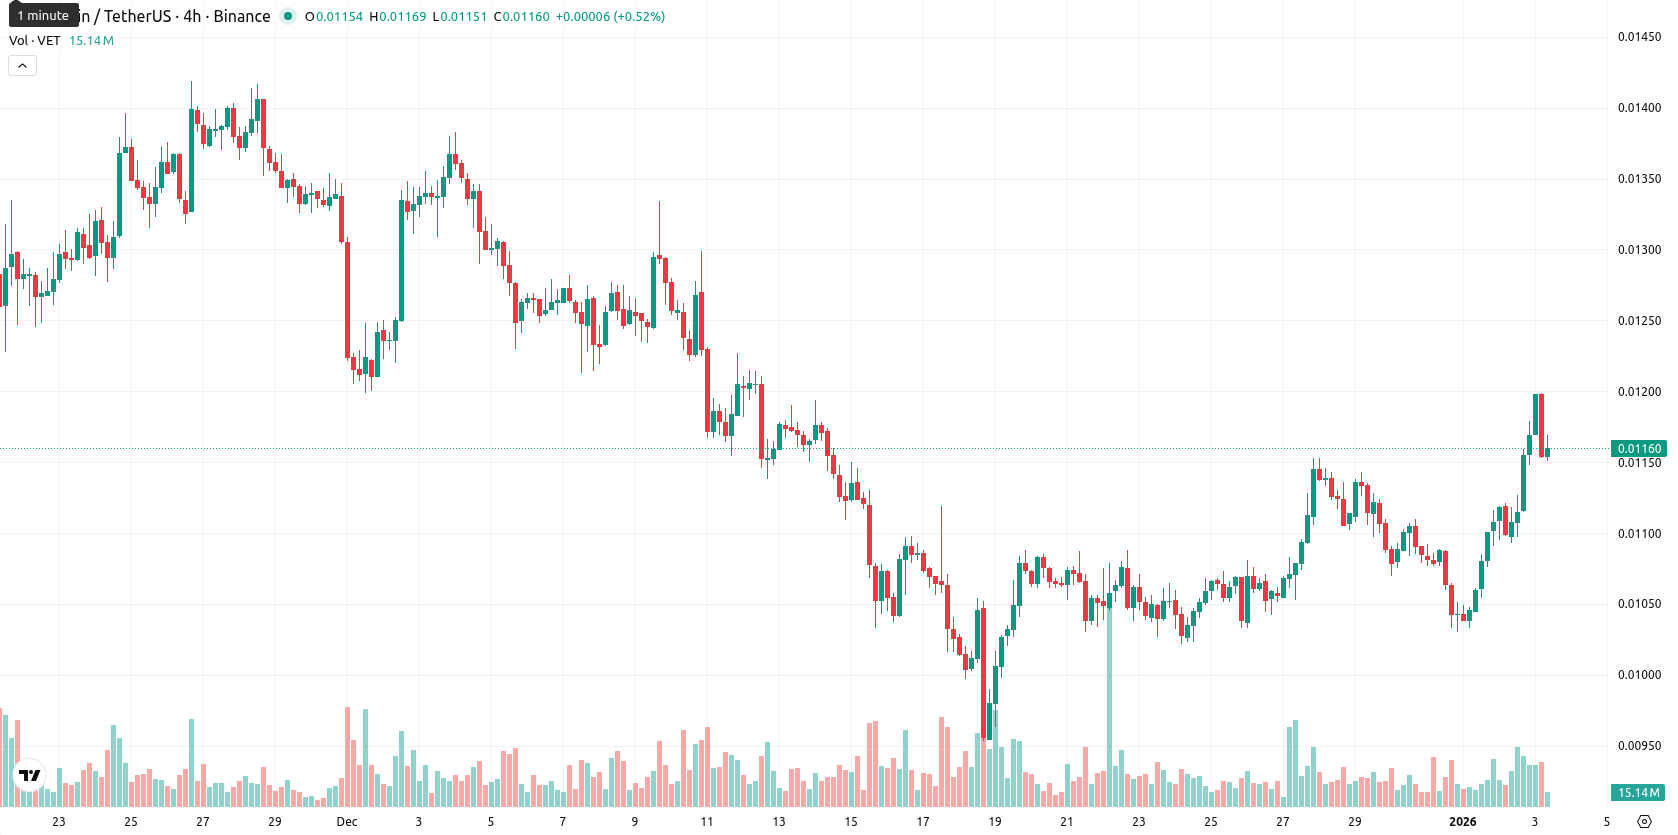
VeChain (VET) is trading at $0.0119, having climbed 7.01% from the previous close. The asset currently sits above the MA-20 ($0.01074925), but remains below the MA-50 ($0.01229630) and MA-200 ($0.01964828), indicating short-term bullish momentum, while medium- and long-term trends remain under pressure.
Highlights
- VeChain (VET) trades at $0.0119, up 7.01% today, positioned above its MA-20 but below both MA-50 ($0.01229630) and MA-200 ($0.01964828).
- Daily technicals show mixed signals: MACD remains bearish, ADX indicates trend strength, RSI is neutral-bullish at 53.26, while CCI and Stoch RSI signal overbought conditions.
- Near-term outlook favors range-bound trading between $0.0111 and $0.01199, with a less than 20% probability of a price increase and downside risk if support at $0.0114 fails.
Divergent momentum signals as overbought risk challenges buyers
Momentum signals present a mixed picture: while MACD on the daily timeframe remains strongly bearish, the ADX points to steady trend strength. The RSI reading at 53.26 reflects a neutral-bullish stance, but both the CCI and Stoch RSI warn of short-term overbought conditions, indicating possible exhaustion. The Bull/Bear Power indicator tilts toward buyers, suggesting strong intraday buying, while the Awesome Oscillator remains neutral. Immediate dynamic support is near the Ichimoku Kijun at $0.011435, while key resistance stands at the MA-50 ($0.01229630).
Downside risk grows as breakout probabilities remain low
Looking ahead five sessions, VET is set to fluctuate in a typical volatility band between $0.0111 and $0.01199, centered at current levels. With the probability of a price increase assessed at less than 20%, a downward move is more likely. The baseline outlook is sideways movement within the $0.0111 to $0.01199 range — a bullish breakout above $0.0123 could open upside, while a slip below $0.0114 would shift momentum decisively bearish.
Previously it was reported that VeChain (VET) is showing short-term bullish momentum above its 20-day moving average, following a breakout and support test at the $0.012 level, though it remains capped by key medium- and long-term moving averages and resistance near the MA-50. Technical indicators reflect mixed intraday momentum—buyer dominance amid elevated volatility and overbought signals, but downside risk persists as weekly trend and broader oscillators remain bearish, suggesting limited prospects for sustained upside and a likely period of sideways consolidation.


Latest VeChain News


-
 Afghanistan
-
 Albania
-
 Algeria
-
 Angola
-
 Argentina
-
 Armenia
-
 Australia
-
 Austria
-
 Azerbaijan
-
 Bahamas
-
 Bahrain
-
 Bangladesh
-
 Belarus
-
 Belgium
-
 Bolivia
-
 Botswana
-
 Brazil
-
 Brunei
-
 Bulgaria
-
 Cambodia
-
 Cameroon
-
 Canada
-
 Chile
Chile
-
 China
China
-
 Colombia
-
 Congo
Congo
-
 Costa Rica
-
 Cote d'Ivoire
-
 Croatia
-
 Cuba
Cuba
-
 Cyprus
-
 Czechia
-
 DR Congo
-
 Denmark
-
 Dominican Republic
-
 Ecuador
-
 Egypt
Egypt
-
 El Salvador
-
 Estonia
-
 Eswatini
-
 Ethiopia
-
 Finland
-
 France
-
 Georgia
-
 Germany
-
 Ghana
Ghana
-
 Greece
-
 Haiti
Haiti
-
 Hong Kong
-
 Hungary
-
 India
India
-
 Indonesia
-
 Iran, Islamic republic
-
 Iraq
Iraq
-
 Ireland
-
 Israel
-
 Italy
Italy
-
 Jamaica
-
 Japan
Japan
-
 Jordan
-
 Kazakhstan
-
 Kenya
Kenya
-
 Korea
Korea
-
 Kuwait
-
 Kyrgyzstan
-
 Laos
Laos
-
 Latvia
-
 Lebanon
-
 Lesotho
-
 Libya
Libya
-
 Lithuania
-
 Luxembourg
-
 Madagascar
-
 Malaysia
-
 Malta
Malta
-
 Mauritius
-
 Mexico
-
 Moldova
-
 Mongolia
-
 Montenegro
-
 Morocco
-
 Mozambique
-
 Myanmar
-
 Namibia
-
 Nepal
Nepal
-
 Netherlands
-
 New Zealand
-
 Nigeria
-
 North Macedonia
-
 Norway
-
 Oman
Oman
-
 Pakistan
-
 Palestine
-
 Panama
-
 Papua New Guinea
-
 Paraguay
-
 Peru
Peru
-
 Philippines
-
 Poland
-
 Portugal
-
 Puerto Rico
-
 Qatar
Qatar
-
 Reunion
-
 Romania
-
 Rwanda
-
 Saudi Arabia
-
 Serbia
-
 Singapore
-
 Slovakia
-
 Slovenia
-
 Somalia
-
 South Africa
-
 Spain
Spain
-
 Sri Lanka
-
 Sweden
-
 Switzerland
-
 Syria
Syria
-
 Taiwan
-
 Tajikistan
-
 Tanzania
-
 Thailand
-
 Trinidad and Tobago
-
 Tunisia
-
 Turkey
-
 UAE
UAE
-
 Uganda
-
 Ukraine
-
 United Kingdom
-
United States
-
 Uruguay
-
 Uzbekistan
-
 Venezuela
-
 Vietnam
-
 Yemen
Yemen
-
 Zambia
-
 Zimbabwe
- Forex
- Crypto
