
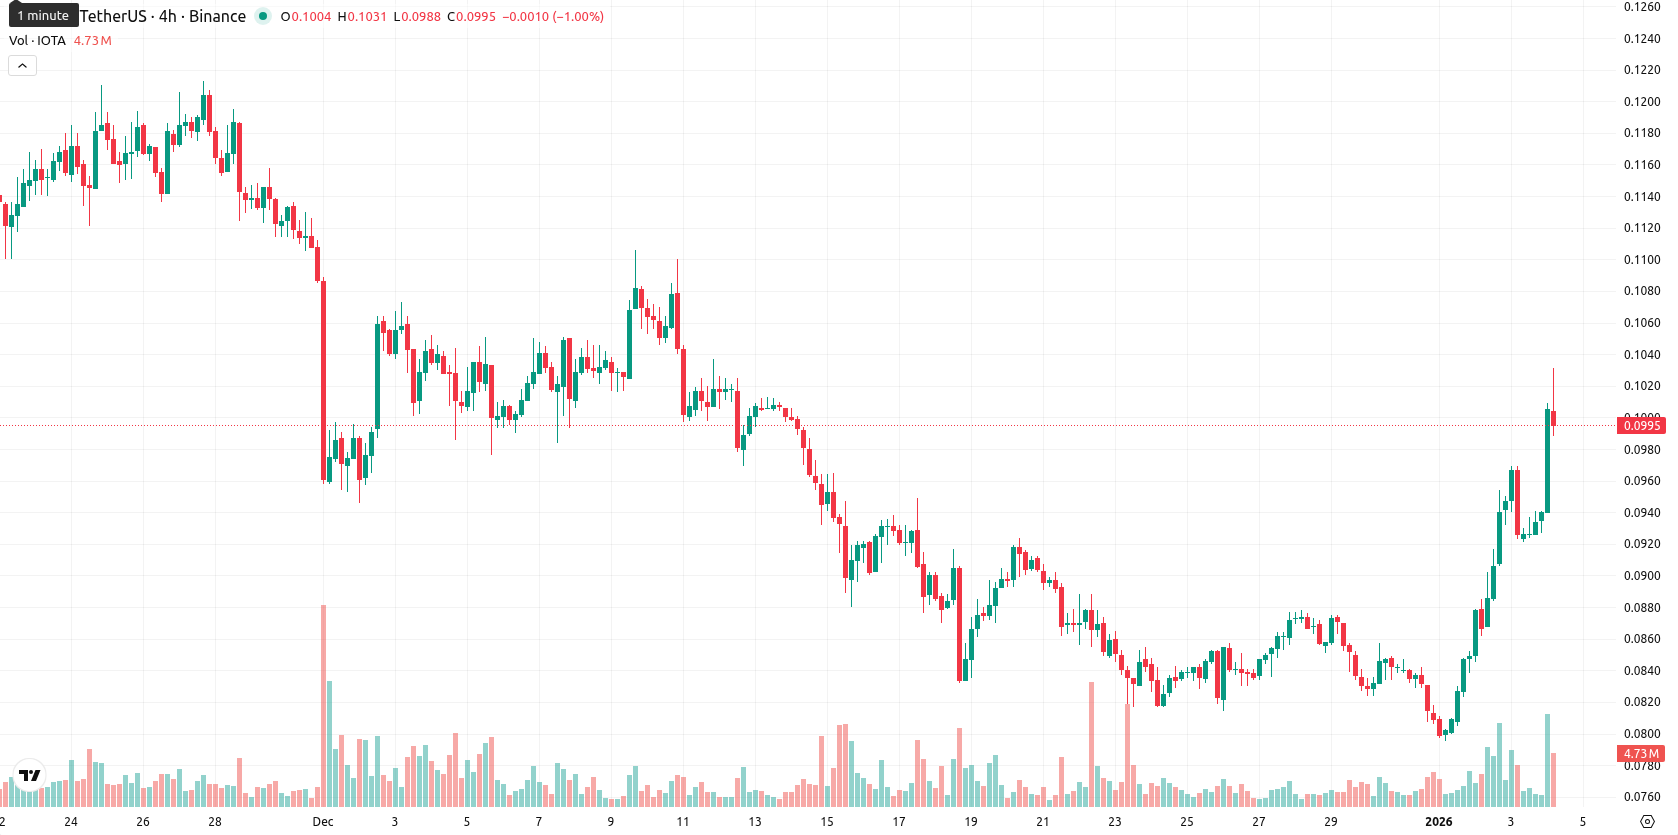
IOTA rallies 7.64% as buyers press above key moving averages despite long-term resistance

IOTA (IOTA) is trading above both its MA-20 ($0.0871) and just above MA-50 ($0.1016), but well below the long-term MA-200 ($0.1589). This configuration signals short-term bullish momentum with medium-term resistance near $0.1020 while long-term bearish pressure continues.
Highlights
- IOTA is trading at $0.1023, above its MA-20 ($0.0871) and MA-50 ($0.1016), but well below the MA-200 at $0.1589, indicating short-term bullish but long-term bearish momentum.
- Daily MACD and ADX show sellers dominating, yet intraday RSI at 51.94 and BBP buy signal reflect near-term buyer strength despite overbought Stoch RSI and CCI readings.
- For the next 5 trading days, a $0.0920–$0.1120 range is expected, with a bearish bias and sideways movement likely unless $0.1020–$0.1050 is firmly surpassed.
Buyer momentum faces resistance as volatility and overbought signals rise
Short-term technical momentum favors buyers as IOTA trades above the 20-day and 50-day moving averages, with dynamic support near the Kijun at $0.0948, but it faces solid long-term resistance below the MA-200 at $0.1589. The broader trend remains dominated by sellers according to the MACD and ADX, though the D1 RSI at 51.94 and BBP buy signal point to intraday bullish control. Overbought readings from both the Stoch RSI and CCI highlight short-term overheating, while heightened volatility and price divergence among oscillators and trend signals hint at underlying instability.
Sideways trade expected as upside breakout odds remain low
Over the next five trading days, typical volatility could keep IOTA within a $0.0920 to $0.1120 band. The probability of a breakout to the upside remains under 20% given persistent weekly bearish indicators. The baseline forecast is for sideways trading as short-term buying momentum attempts to stabilize price action; a move above $0.1020 – $0.1050 could target $0.1120, while a failure of $0.0948 support exposes $0.0920 or lower.
Last time, analysts noted IOTA was trading above its short-term moving average but remained capped by medium- and long-term resistance, reflecting mixed momentum amid volatility. Technical indicators, including a neutral oscillator and overbought Stoch RSI, signal sideways movement is likely, with consolidation expected between nearby support and resistance and upside potential remaining limited.


Latest IOTA News


-
 Afghanistan
-
 Albania
-
 Algeria
-
 Angola
-
 Argentina
-
 Armenia
-
 Australia
-
 Austria
-
 Azerbaijan
-
 Bahamas
-
 Bahrain
-
 Bangladesh
-
 Belarus
-
 Belgium
-
 Bolivia
-
 Botswana
-
 Brazil
-
 Brunei
-
 Bulgaria
-
 Cambodia
-
 Cameroon
-
 Canada
-
 Chile
Chile
-
 China
China
-
 Colombia
-
 Congo
Congo
-
 Costa Rica
-
 Cote d'Ivoire
-
 Croatia
-
 Cuba
Cuba
-
 Cyprus
-
 Czechia
-
 DR Congo
-
 Denmark
-
 Dominican Republic
-
 Ecuador
-
 Egypt
Egypt
-
 El Salvador
-
 Estonia
-
 Eswatini
-
 Ethiopia
-
 Finland
-
 France
-
 Georgia
-
 Germany
-
 Ghana
Ghana
-
 Greece
-
 Haiti
Haiti
-
 Hong Kong
-
 Hungary
-
 India
India
-
 Indonesia
-
 Iran, Islamic republic
-
 Iraq
Iraq
-
 Ireland
-
 Israel
-
 Italy
Italy
-
 Jamaica
-
 Japan
Japan
-
 Jordan
-
 Kazakhstan
-
 Kenya
Kenya
-
 Korea
Korea
-
 Kuwait
-
 Kyrgyzstan
-
 Laos
Laos
-
 Latvia
-
 Lebanon
-
 Lesotho
-
 Libya
Libya
-
 Lithuania
-
 Luxembourg
-
 Madagascar
-
 Malaysia
-
 Malta
Malta
-
 Mauritius
-
 Mexico
-
 Moldova
-
 Mongolia
-
 Montenegro
-
 Morocco
-
 Mozambique
-
 Myanmar
-
 Namibia
-
 Nepal
Nepal
-
 Netherlands
-
 New Zealand
-
 Nigeria
-
 North Macedonia
-
 Norway
-
 Oman
Oman
-
 Pakistan
-
 Palestine
-
 Panama
-
 Papua New Guinea
-
 Paraguay
-
 Peru
Peru
-
 Philippines
-
 Poland
-
 Portugal
-
 Puerto Rico
-
 Qatar
Qatar
-
 Reunion
-
 Romania
-
 Rwanda
-
 Saudi Arabia
-
 Serbia
-
 Singapore
-
 Slovakia
-
 Slovenia
-
 Somalia
-
 South Africa
-
 Spain
Spain
-
 Sri Lanka
-
 Sweden
-
 Switzerland
-
 Syria
Syria
-
 Taiwan
-
 Tajikistan
-
 Tanzania
-
 Thailand
-
 Trinidad and Tobago
-
 Tunisia
-
 Turkey
-
 UAE
UAE
-
 Uganda
-
 Ukraine
-
 United Kingdom
-
United States
-
 Uruguay
-
 Uzbekistan
-
 Venezuela
-
 Vietnam
-
 Yemen
Yemen
-
 Zambia
-
 Zimbabwe
- Forex
- Crypto
