
VeChain surges 7.29% as bullish technicals and strong enterprise interest drive momentum

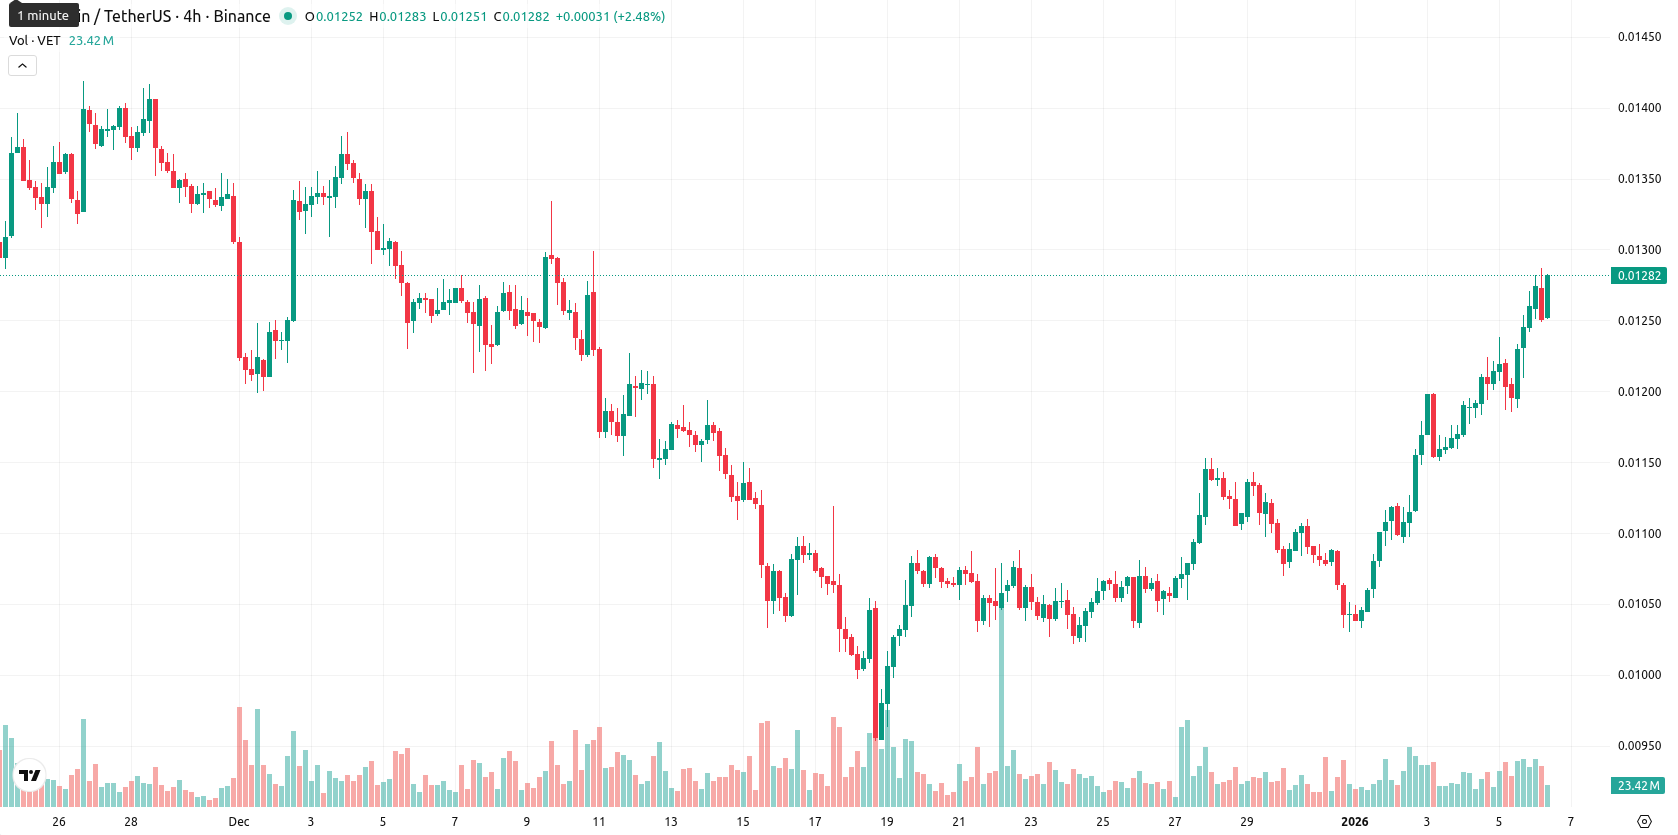
VeChain (VET) is trading above its MA-20 ($0.010930), above MA-50 ($0.012101), but well below MA-200 ($0.019506), indicating short- and medium-term bullish momentum within a longer-term bearish structure.
Highlights
- VeChain's 2026 manifesto focuses on deploying blockchain for real-world enterprise applications, notably in supply chain management and logistics solutions.
- Growing enterprise partnerships are actively piloting VeChain’s platform for practical adoption, reflecting regulator and corporate shifts toward utility-driven blockchain use cases.
- VeChain’s engagement with enterprise clients has increased, underscoring rising market interest in blockchain projects emphasizing utility rather than purely speculative drivers.
Enterprise adoption and real-world uses boost project engagement
VeChain has released its 2026 manifesto, highlighting a focus on applying blockchain technology to real-world use cases like supply chain management and enterprise solutions. The initiative aligns with trends among enterprises and regulators prioritizing practical blockchain adoption for logistics and supply chain operations. This direction is underpinned by growing enterprise partnerships actively testing VeChain’s platform for these purposes. Market interest in utility-driven projects is reflected in VeChain’s increased engagement with enterprise clients.
Upside momentum meets overbought signals amid rising volatility
The nearest dynamic support is at the Ichimoku Kijun ($0.011115), with resistance likely at the MA-50 ($0.012101) and then at the next round level near $0.013. Momentum indicators provide mixed signals: D1 ADX is strong at 30 and trending up, but D1 MACD is neutral. RSI is bullish at 61, yet both Stochastic RSI and CCI signal overbought conditions. BBP shows buyer dominance intraday. The Awesome Oscillator supports continued upside, aligning with the day’s strong 7.29% gain. There was a small upward gap at the open, and the price is near today’s high ($0.01285), showing high volatility and strength toward the session top; however, overbought oscillators introduce some caution and point to a possible divergence between short-term momentum and daily performance.
Sideways bias dominates as bearish signals outweigh breakout risk
For the next five trading days, the expected price range is $0.01175 to $0.01285, which corresponds to the typical volatility band relative to current levels. The probability of a further price increase is very low (less than 20%), while a decline is more likely, given that weekly MA, RSI, and MACD remain bearish. The baseline scenario anticipates a sideways corridor within this range. A bullish scenario would see VET breaking above the $0.01285 resistance, potentially targeting new local highs, while a bearish scenario could emerge if the price falls below $0.01175 support, leading to a deeper pullback.
Last time, analysts noted that VeChain exhibited short-term bullish momentum above its 20-day moving average, while remaining constrained below the 50- and 200-day averages, highlighting lingering medium- and long-term pressure. Momentum indicators present a mixed outlook, with overbought signals challenging buyers despite neutral-bullish RSI and steady trend strength, as key support lies near $0.011435 and resistance at $0.01229630.


Latest VeChain News


-
 Afghanistan
-
 Albania
-
 Algeria
-
 Angola
-
 Argentina
-
 Armenia
-
 Australia
-
 Austria
-
 Azerbaijan
-
 Bahamas
-
 Bahrain
-
 Bangladesh
-
 Belarus
-
 Belgium
-
 Bolivia
-
 Botswana
-
 Brazil
-
 Brunei
-
 Bulgaria
-
 Cambodia
-
 Cameroon
-
 Canada
-
 Chile
Chile
-
 China
China
-
 Colombia
-
 Congo
Congo
-
 Costa Rica
-
 Cote d'Ivoire
-
 Croatia
-
 Cuba
Cuba
-
 Cyprus
-
 Czechia
-
 DR Congo
-
 Denmark
-
 Dominican Republic
-
 Ecuador
-
 Egypt
Egypt
-
 El Salvador
-
 Estonia
-
 Eswatini
-
 Ethiopia
-
 Finland
-
 France
-
 Georgia
-
 Germany
-
 Ghana
Ghana
-
 Greece
-
 Haiti
Haiti
-
 Hong Kong
-
 Hungary
-
 India
India
-
 Indonesia
-
 Iran, Islamic republic
-
 Iraq
Iraq
-
 Ireland
-
 Israel
-
 Italy
Italy
-
 Jamaica
-
 Japan
Japan
-
 Jordan
-
 Kazakhstan
-
 Kenya
Kenya
-
 Korea
Korea
-
 Kuwait
-
 Kyrgyzstan
-
 Laos
Laos
-
 Latvia
-
 Lebanon
-
 Lesotho
-
 Libya
Libya
-
 Lithuania
-
 Luxembourg
-
 Madagascar
-
 Malaysia
-
 Malta
Malta
-
 Mauritius
-
 Mexico
-
 Moldova
-
 Mongolia
-
 Montenegro
-
 Morocco
-
 Mozambique
-
 Myanmar
-
 Namibia
-
 Nepal
Nepal
-
 Netherlands
-
 New Zealand
-
 Nigeria
-
 North Macedonia
-
 Norway
-
 Oman
Oman
-
 Pakistan
-
 Palestine
-
 Panama
-
 Papua New Guinea
-
 Paraguay
-
 Peru
Peru
-
 Philippines
-
 Poland
-
 Portugal
-
 Puerto Rico
-
 Qatar
Qatar
-
 Reunion
-
 Romania
-
 Rwanda
-
 Saudi Arabia
-
 Serbia
-
 Singapore
-
 Slovakia
-
 Slovenia
-
 Somalia
-
 South Africa
-
 Spain
Spain
-
 Sri Lanka
-
 Sweden
-
 Switzerland
-
 Syria
Syria
-
 Taiwan
-
 Tajikistan
-
 Tanzania
-
 Thailand
-
 Trinidad and Tobago
-
 Tunisia
-
 Turkey
-
 UAE
UAE
-
 Uganda
-
 Ukraine
-
 United Kingdom
-
United States
-
 Uruguay
-
 Uzbekistan
-
 Venezuela
-
 Vietnam
-
 Yemen
Yemen
-
 Zambia
-
 Zimbabwe
- Forex
- Crypto
