
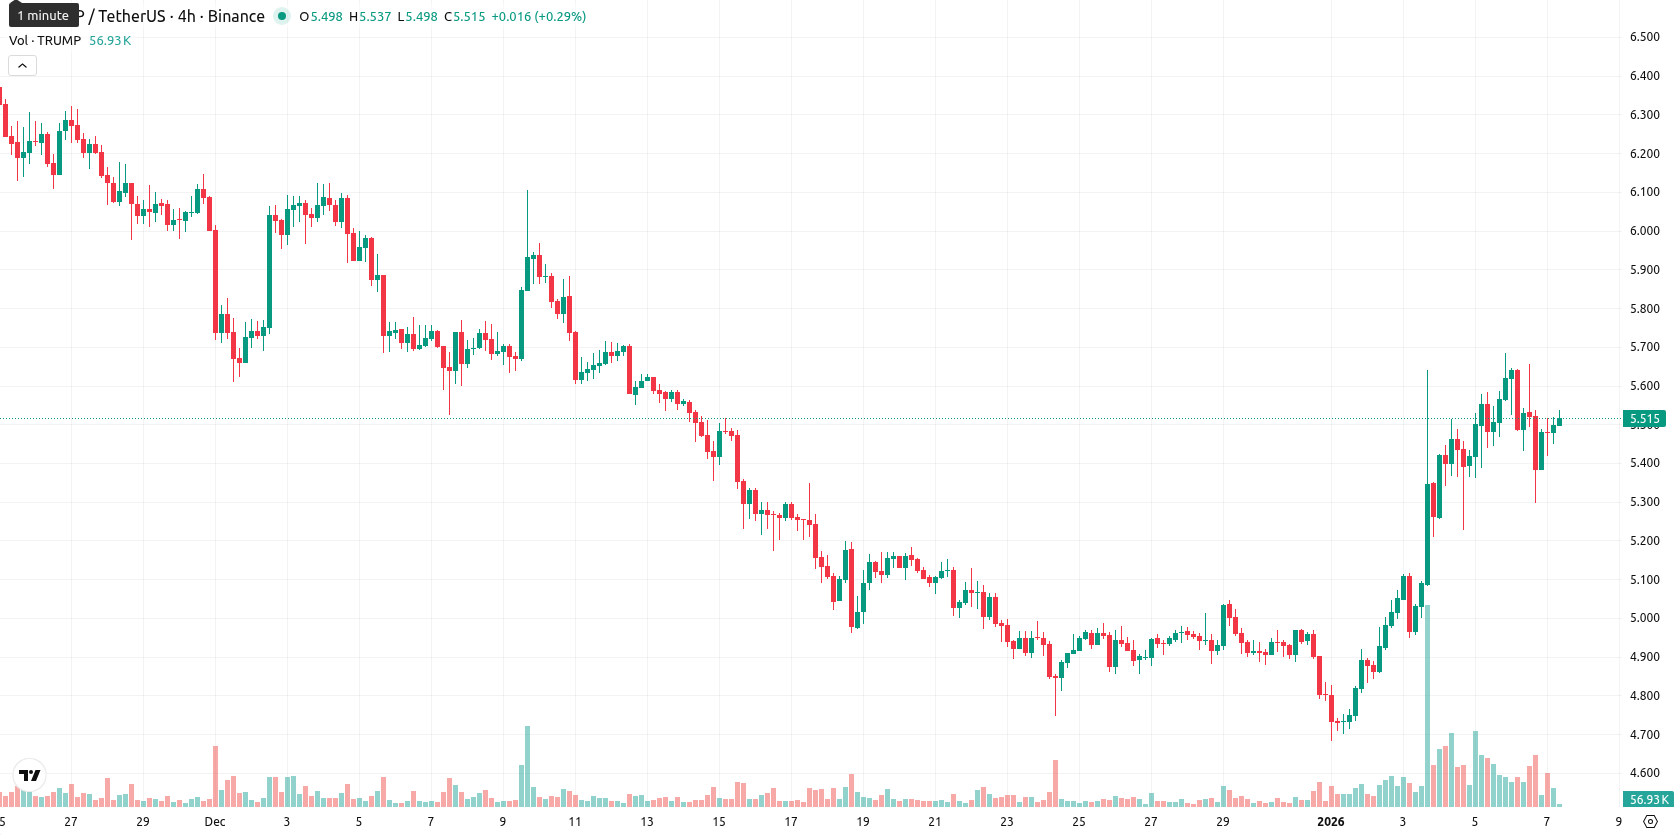
Consolidation for TRUMP — volatility band narrows between $5.30 and $5.45

Official Trump (TRUMP) is trading at $5.50 after a modest session gain of 0.15%. The price remains above the MA-20 at $5.06 but trades just below the MA-50 at $5.60, with the long-term MA-200 at $7.64 well overhead. TRUMP’s position relative to these moving averages suggests a short-term bullish tone, medium-term resistance, and persistent downward pressure from longer-term trends.
Highlights
- TRUMP is trading at $5.50, above the MA-20 ($5.06) and just below the MA-50 ($5.60), indicating short-term bullish momentum with medium-term resistance.
- Momentum indicators are mixed, with buyers gaining traction according to the ADX and Awesome Oscillator, but the MACD (D1) signaled a strong sell, and overbought readings on Stochastic RSI and CCI warn of exhaustion.
- Weekly signals remain bearish, with a 20% probability of a sustained rally and baseline consolidation expected in a $5.30–$5.45 range; a move above $5.60 or below $5.20 would alter direction.
Upside exhaustion warning as momentum indicators sharply diverge
Momentum signals are sending mixed messages: while the ADX highlights strengthening buyer interest, the MACD (daily) continues to indicate a strong sell, resulting in a significant divergence between them. Both the Stochastic RSI and CCI show overbought conditions, suggesting upside exhaustion, yet the RSI remains neutral-bullish. Bull/Bear Power readings are positive intraday and the Awesome Oscillator is consistent with the short-term bullish bias. On the session, TRUMP opened without a significant gap and is now trading near the session high, showing low volatility and modest strength after the open. Key technical levels include dynamic support near the Ichimoku Kijun at $5.20 and resistance at the MA-50 ($5.60).
Sideways consolidation expected as bearish signals dominate outlook
For the coming week, the typical volatility band is expected between $5.30 and $5.45, consistent with current price action. A strong move higher appears unlikely (below 20% probability), as weekly MACD, RSI, and ADX all support a bearish outlook. The base expectation is for TRUMP to consolidate in a narrow sideways band near $5.38. Any bullish breakout would require a close above $5.60, while a drop below $5.20 would signal further declines.
Previously it was reported that Official Trump exhibits short-term bullish momentum above its 20-day average but faces medium-term resistance at the 50-day moving average, with the long-term trend remaining bearish as the price stays far below the 200-day average. Despite near-term buyer strength signaled by some oscillators, multiple key momentum indicators and overbought conditions point to downside risk dominating, with price action likely staying rangebound between established support and resistance levels barring a decisive move.


-
 Afghanistan
-
 Albania
-
 Algeria
-
 Angola
-
 Argentina
-
 Armenia
-
 Australia
-
 Austria
-
 Azerbaijan
-
 Bahamas
-
 Bahrain
-
 Bangladesh
-
 Belarus
-
 Belgium
-
 Bolivia
-
 Botswana
-
 Brazil
-
 Brunei
-
 Bulgaria
-
 Cambodia
-
 Cameroon
-
 Canada
-
 Chile
Chile
-
 China
China
-
 Colombia
-
 Congo
Congo
-
 Costa Rica
-
 Cote d'Ivoire
-
 Croatia
-
 Cuba
Cuba
-
 Cyprus
-
 Czechia
-
 DR Congo
-
 Denmark
-
 Dominican Republic
-
 Ecuador
-
 Egypt
Egypt
-
 El Salvador
-
 Estonia
-
 Eswatini
-
 Ethiopia
-
 Finland
-
 France
-
 Georgia
-
 Germany
-
 Ghana
Ghana
-
 Greece
-
 Haiti
Haiti
-
 Hong Kong
-
 Hungary
-
 India
India
-
 Indonesia
-
 Iran, Islamic republic
-
 Iraq
Iraq
-
 Ireland
-
 Israel
-
 Italy
Italy
-
 Jamaica
-
 Japan
Japan
-
 Jordan
-
 Kazakhstan
-
 Kenya
Kenya
-
 Korea
Korea
-
 Kuwait
-
 Kyrgyzstan
-
 Laos
Laos
-
 Latvia
-
 Lebanon
-
 Lesotho
-
 Libya
Libya
-
 Lithuania
-
 Luxembourg
-
 Madagascar
-
 Malaysia
-
 Malta
Malta
-
 Mauritius
-
 Mexico
-
 Moldova
-
 Mongolia
-
 Montenegro
-
 Morocco
-
 Mozambique
-
 Myanmar
-
 Namibia
-
 Nepal
Nepal
-
 Netherlands
-
 New Zealand
-
 Nigeria
-
 North Macedonia
-
 Norway
-
 Oman
Oman
-
 Pakistan
-
 Palestine
-
 Panama
-
 Papua New Guinea
-
 Paraguay
-
 Peru
Peru
-
 Philippines
-
 Poland
-
 Portugal
-
 Puerto Rico
-
 Qatar
Qatar
-
 Reunion
-
 Romania
-
 Rwanda
-
 Saudi Arabia
-
 Serbia
-
 Singapore
-
 Slovakia
-
 Slovenia
-
 Somalia
-
 South Africa
-
 Spain
Spain
-
 Sri Lanka
-
 Sweden
-
 Switzerland
-
 Syria
Syria
-
 Taiwan
-
 Tajikistan
-
 Tanzania
-
 Thailand
-
 Trinidad and Tobago
-
 Tunisia
-
 Turkey
-
 UAE
UAE
-
 Uganda
-
 Ukraine
-
 United Kingdom
-
United States
-
 Uruguay
-
 Uzbekistan
-
 Venezuela
-
 Vietnam
-
 Yemen
Yemen
-
 Zambia
-
 Zimbabwe
- Forex
- Crypto
