
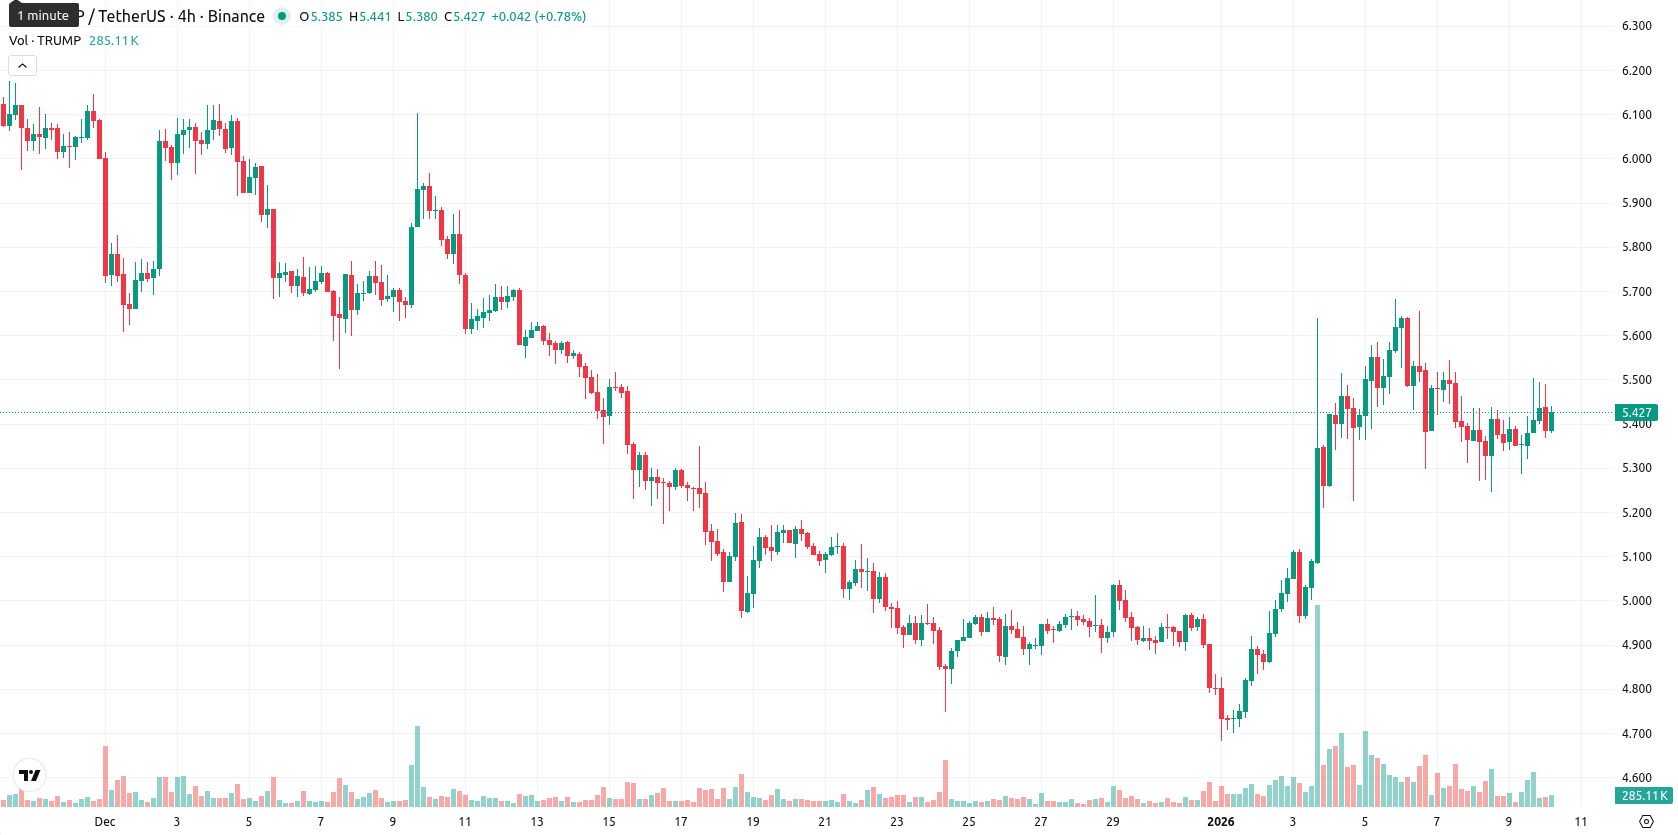
TRUMP price prediction: Sideways band expected? TRUMP gains 1.34%

Official Trump (TRUMP) is trading at $5.43, above the MA-20 at $5.11 but just under the MA-50 at $5.51, while the much higher MA-200 at $7.59 signals long-term bearish pressure. This positioning suggests a supportive near-term trend, but medium- and long-term sellers remain in control, with the nearest dynamic support at the Ichimoku Kijun level of $5.18 and MA-50 at $5.51 acting as resistance overhead.
Highlights
- TRUMP is trading at $5.43, sitting above the MA-20 ($5.11) but just below the MA-50 ($5.51), and remains well under the MA-200 ($7.59), signaling continued long-term bearish pressure.
- Momentum indicators are mixed as the MACD is neutral, ADX is 23.59, RSI is 55.53, CCI is near 97, and the Stochastic RSI indicates overbought conditions, highlighting risk of short-term consolidation.
- The expected price range over the next five days is $5.26–$5.41, with less than 20% probability of a price increase and likely sideways trading unless a breakout above $5.51 or a drop below $5.18 occurs.
Mixed momentum and overbought signals raise consolidation risk
Momentum indicators are mixed with the MACD on D1 remaining neutral and the ADX at 23.59 indicating moderate trend strength. The RSI at 55.53 and CCI near 97 point to emerging buying interest, but the Stochastic RSI signals overbought conditions, highlighting potential for short-term pullbacks. Bull/Bear Power is positive at 0.22, favoring buyers in intraday sessions, and the Awesome Oscillator supports the prevailing upward bias. There was a slight uptick at the open with no substantial gap, and the current price sits near mid-range in today’s $5.37 – $5.49 band. Volatility is moderate and intraday tone remains steady with buyers maintaining pressure after the open. Divergences between neutral momentum and signals of overbought highlight the risk of near-term consolidation or loss of upside momentum.
Sideways movement likely as upside prospects remain limited
For the next 5 days, the expected price corridor is $5.26 to $5.41, fitting within a typical volatility band relative to current levels. Based on D1 and W1 indicator signals, the probability of a price increase is very low (less than 20%), making a pullback more likely. In the baseline scenario, the price is likely to hold in a sideways band between $5.26 and $5.41 as buyers and sellers balance out. A bullish scenario would require a breakout above the $5.51 resistance to trigger renewed momentum, but the dominant weekly indicators make this less likely. If the price falls below the Kijun support at $5.18, a bearish acceleration could follow, targeting levels below $5.26.
Last time, analysts noted that despite Official Trump showing short-term bullish momentum above its 20-day moving average, the asset remains locked between key resistance at the 50-day MA and support near $5.18, with rangebound trade limiting upside efforts. Current momentum indicators, including flat MACD and weak ADX, point to consolidation within a narrow band and an elevated probability of further downside unless a breakout above the 50-day MA occurs.


-
 Afghanistan
-
 Albania
-
 Algeria
-
 Angola
-
 Argentina
-
 Armenia
-
 Australia
-
 Austria
-
 Azerbaijan
-
 Bahamas
-
 Bahrain
-
 Bangladesh
-
 Belarus
-
 Belgium
-
 Bolivia
-
 Botswana
-
 Brazil
-
 Brunei
-
 Bulgaria
-
 Cambodia
-
 Cameroon
-
 Canada
-
 Chile
Chile
-
 China
China
-
 Colombia
-
 Congo
Congo
-
 Costa Rica
-
 Cote d'Ivoire
-
 Croatia
-
 Cuba
Cuba
-
 Cyprus
-
 Czechia
-
 DR Congo
-
 Denmark
-
 Dominican Republic
-
 Ecuador
-
 Egypt
Egypt
-
 El Salvador
-
 Estonia
-
 Eswatini
-
 Ethiopia
-
 Finland
-
 France
-
 Georgia
-
 Germany
-
 Ghana
Ghana
-
 Greece
-
 Haiti
Haiti
-
 Hong Kong
-
 Hungary
-
 India
India
-
 Indonesia
-
 Iran, Islamic republic
-
 Iraq
Iraq
-
 Ireland
-
 Israel
-
 Italy
Italy
-
 Jamaica
-
 Japan
Japan
-
 Jordan
-
 Kazakhstan
-
 Kenya
Kenya
-
 Korea
Korea
-
 Kuwait
-
 Kyrgyzstan
-
 Laos
Laos
-
 Latvia
-
 Lebanon
-
 Lesotho
-
 Libya
Libya
-
 Lithuania
-
 Luxembourg
-
 Madagascar
-
 Malaysia
-
 Malta
Malta
-
 Mauritius
-
 Mexico
-
 Moldova
-
 Mongolia
-
 Montenegro
-
 Morocco
-
 Mozambique
-
 Myanmar
-
 Namibia
-
 Nepal
Nepal
-
 Netherlands
-
 New Zealand
-
 Nigeria
-
 North Macedonia
-
 Norway
-
 Oman
Oman
-
 Pakistan
-
 Palestine
-
 Panama
-
 Papua New Guinea
-
 Paraguay
-
 Peru
Peru
-
 Philippines
-
 Poland
-
 Portugal
-
 Puerto Rico
-
 Qatar
Qatar
-
 Reunion
-
 Romania
-
 Rwanda
-
 Saudi Arabia
-
 Serbia
-
 Singapore
-
 Slovakia
-
 Slovenia
-
 Somalia
-
 South Africa
-
 Spain
Spain
-
 Sri Lanka
-
 Sweden
-
 Switzerland
-
 Syria
Syria
-
 Taiwan
-
 Tajikistan
-
 Tanzania
-
 Thailand
-
 Trinidad and Tobago
-
 Tunisia
-
 Turkey
-
 UAE
UAE
-
 Uganda
-
 Ukraine
-
 United Kingdom
-
United States
-
 Uruguay
-
 Uzbekistan
-
 Venezuela
-
 Vietnam
-
 Yemen
Yemen
-
 Zambia
-
 Zimbabwe
- Forex
- Crypto
