
-7.17% for Theta — sellers remain dominant amid weak daily momentum

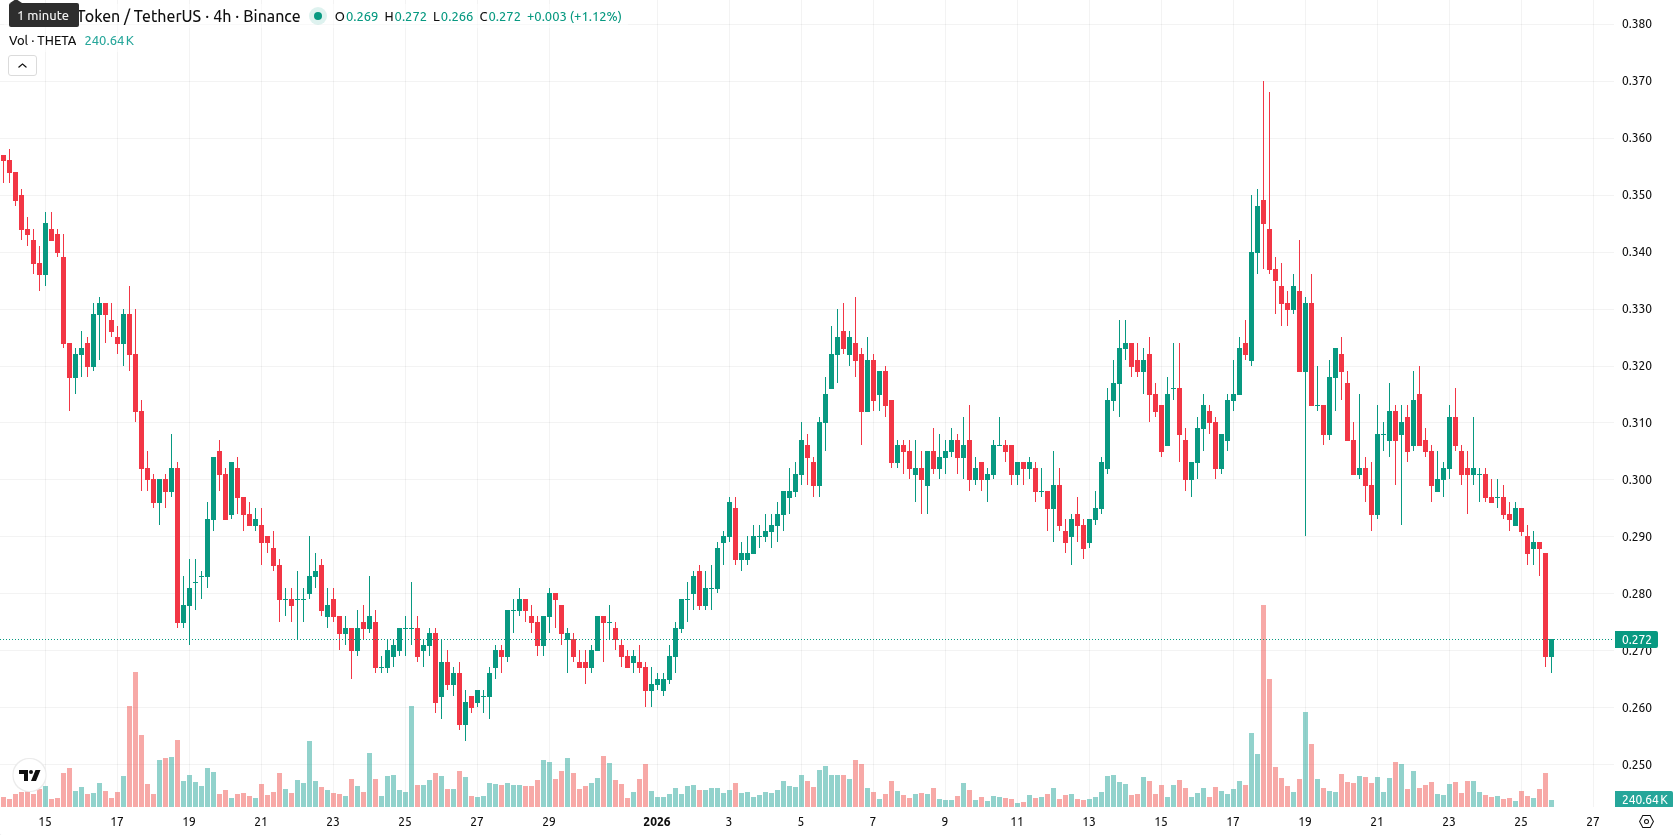
Theta (THETA) is trading at $0.272, marking a daily drop of 7.17% in a volatile session. The asset remains well below its MA-20 ($0.3087500), MA-50 ($0.3048000), and MA-200 ($0.5807500), highlighting persistent bearish pressure across all major trend indicators.
Highlights
- THETA trades at $0.272, significantly below its MA-20 ($0.30875), MA-50 ($0.3048), and MA-200 ($0.58075), signaling bearish momentum across all time frames.
- Daily momentum indicators remain weak, with MACD neutral, low ADX, persistent bearish swing from the RSI, and multiple oversold oscillator readings.
- If bearish momentum intensifies, a breakdown below $0.240 support is likely, while resistance is set at $0.315 (Ichimoku Kijun); sideways consolidation is the baseline scenario.
Bearish momentum prevails as indicators show sellers dominating
The technical backdrop for THETA is defined by a strong bearish bias, with price action remaining under all major moving averages and the nearest dynamic resistance established at the Ichimoku Kijun ($0.315). Oscillator readings (Stochastic RSI and CCI) indicate oversold conditions, while the RSI issues a sell signal, MACD remains neutral, and Bull/Bear Power underscores continued seller dominance. Daily momentum is weak, with low ADX showing a meager trend and intraday action accentuating sustained selling pressure likely reaching exhaustion.
Further downside risk as minimal rebound probability persists
For the next week, trading is expected within a volatility band of $0.240–$0.300 relative to current levels. The probability of a price increase is low (under 20%), and further declines are likely in the short term. The baseline scenario favors sideways consolidation; however, a move above the $0.315 resistance is needed to trigger a rebound, while a breakdown below $0.240 would signal further losses.
Last time, analysts noted that Theta Network was trading above its short- and medium-term moving averages but remained well below the long-term MA, signaling short-term bullishness within a longer-term downtrend. Momentum indicators are mixed, with mild bullish bias reflected in RSI and some oscillators, while resistance levels near the current price and weak trend strength suggest caution as upside momentum is not firmly established.


Latest Theta News


-
 Afghanistan
-
 Albania
-
 Algeria
-
 Angola
-
 Argentina
-
 Armenia
-
 Australia
-
 Austria
-
 Azerbaijan
-
 Bahamas
-
 Bahrain
-
 Bangladesh
-
 Belarus
-
 Belgium
-
 Bolivia
-
 Botswana
-
 Brazil
-
 Brunei
-
 Bulgaria
-
 Cambodia
-
 Cameroon
-
 Canada
-
 Chile
Chile
-
 China
China
-
 Colombia
-
 Congo
Congo
-
 Costa Rica
-
 Cote d'Ivoire
-
 Croatia
-
 Cuba
Cuba
-
 Cyprus
-
 Czechia
-
 DR Congo
-
 Denmark
-
 Dominican Republic
-
 Ecuador
-
 Egypt
Egypt
-
 El Salvador
-
 Estonia
-
 Eswatini
-
 Ethiopia
-
 Finland
-
 France
-
 Georgia
-
 Germany
-
 Ghana
Ghana
-
 Greece
-
 Haiti
Haiti
-
 Hong Kong
-
 Hungary
-
 India
India
-
 Indonesia
-
 Iran, Islamic republic
-
 Iraq
Iraq
-
 Ireland
-
 Israel
-
 Italy
Italy
-
 Jamaica
-
 Japan
Japan
-
 Jordan
-
 Kazakhstan
-
 Kenya
Kenya
-
 Korea
Korea
-
 Kuwait
-
 Kyrgyzstan
-
 Laos
Laos
-
 Latvia
-
 Lebanon
-
 Lesotho
-
 Libya
Libya
-
 Lithuania
-
 Luxembourg
-
 Madagascar
-
 Malaysia
-
 Malta
Malta
-
 Mauritius
-
 Mexico
-
 Moldova
-
 Mongolia
-
 Montenegro
-
 Morocco
-
 Mozambique
-
 Myanmar
-
 Namibia
-
 Nepal
Nepal
-
 Netherlands
-
 New Zealand
-
 Nigeria
-
 North Macedonia
-
 Norway
-
 Oman
Oman
-
 Pakistan
-
 Palestine
-
 Panama
-
 Papua New Guinea
-
 Paraguay
-
 Peru
Peru
-
 Philippines
-
 Poland
-
 Portugal
-
 Puerto Rico
-
 Qatar
Qatar
-
 Reunion
-
 Romania
-
 Rwanda
-
 Saudi Arabia
-
 Serbia
-
 Singapore
-
 Slovakia
-
 Slovenia
-
 Somalia
-
 South Africa
-
 Spain
Spain
-
 Sri Lanka
-
 Sweden
-
 Switzerland
-
 Syria
Syria
-
 Taiwan
-
 Tajikistan
-
 Tanzania
-
 Thailand
-
 Trinidad and Tobago
-
 Tunisia
-
 Turkey
-
 UAE
UAE
-
 Uganda
-
 Ukraine
-
 United Kingdom
-
United States
-
 Uruguay
-
 Uzbekistan
-
 Venezuela
-
 Vietnam
-
 Yemen
Yemen
-
 Zambia
-
 Zimbabwe
- Forex
- Crypto
