
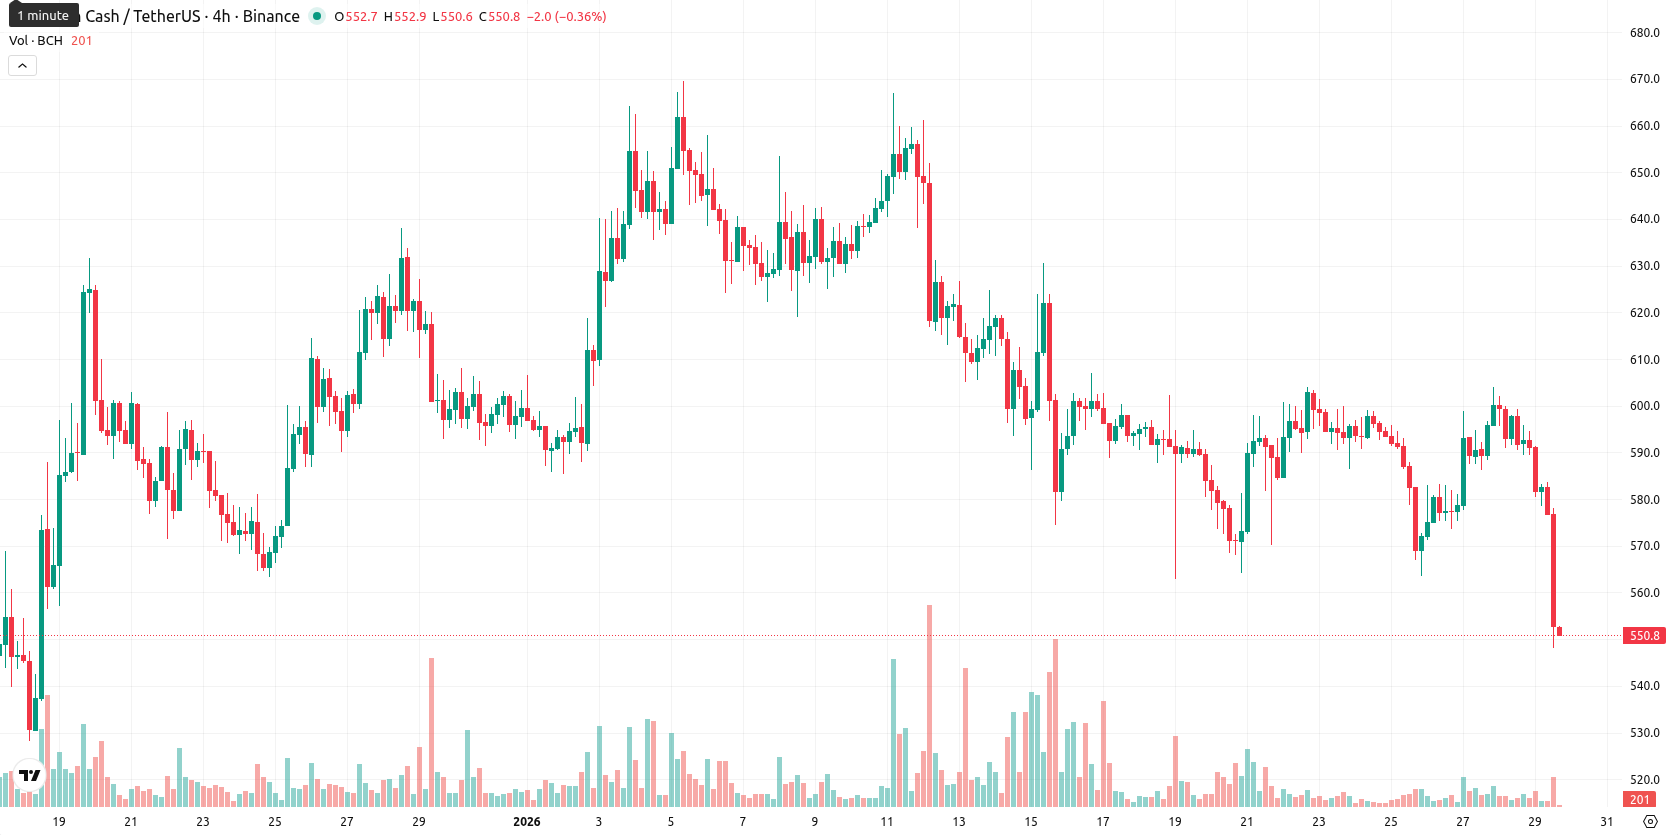
Bitcoin Cash price prediction: Can $530 support hold? BCH falls 7% on weak technicals

Bitcoin Cash (BCH) is trading at $550.20 after a sharp daily drop of $42.50, down 7.17%. The asset remains firmly below both its MA-20 at $600.61 and MA-50 at $597.60, and just under the MA-200 at $561.58, highlighting continued short- and medium-term downward pressure while longer-term support persists.
Highlights
- Bitcoin Cash trades at $550.20, below the MA-20 ($600.61) and MA-50 ($597.60), indicating sustained short- and medium-term downward pressure.
- MACD signals a sell and ADX reads 14.24, confirming weak trend strength as the price drops 7.17% ($42.50) today with high volatility.
- Key technical levels are MA-200 support at $561.58 and resistance at the Ichimoku Kijun ($616.20), with a likely trading range of $530–$575 over the next 5 days.
Bearish signals strengthen as momentum weakens and resistance holds
The Ichimoku Kijun provides nearest resistance at $616.20, whereas dynamic support is clustered near the MA-200 at $561.58. There is no golden or death cross between MA-50 and MA-200. Bearish bias is reflected in momentum indicators: MACD emits a sell signal and ADX is low at 14.24, showing a weak overall trend. With the RSI just below neutral at 47.92 and most oscillators edging into oversold on intraday intervals, selling momentum remains dominant. Bull/Bear Power suggests overbought conditions on the daily, but deep oversold readings intraday; the Awesome Oscillator corroborates the bearish view.
Volatility persists as split outlook hinges on technical break
In the coming 5 trading days, BCH is likely to fluctuate within a typical volatility band of $530 to $575. Probabilities are evenly split near 50% for both upward correction and further decline as longer-term indicators retain a neutral-to-bullish stance, but the daily set-up is weak. A move above $575 – $590 would signal bullish momentum toward major resistance at the Ichimoku Kijun. If support at $530 breaks, new weekly lows may occur as seller pressure persists.
Previously it was reported that Bitcoin Cash is trading above key moving averages and the Ichimoku Kijun line, with bullish readings on the RSI and MACD, while neutral signals predominate on other momentum indicators. Current technicals suggest mild upside bias amid consolidation, with anticipated resistance near $604 and support around $578.


Latest Bitcoin Cash News


-
 Afghanistan
-
 Albania
-
 Algeria
-
 Angola
-
 Argentina
-
 Armenia
-
 Australia
-
 Austria
-
 Azerbaijan
-
 Bahamas
-
 Bahrain
-
 Bangladesh
-
 Belarus
-
 Belgium
-
 Bolivia
-
 Botswana
-
 Brazil
-
 Brunei
-
 Bulgaria
-
 Cambodia
-
 Cameroon
-
 Canada
-
 Chile
Chile
-
 China
China
-
 Colombia
-
 Congo
Congo
-
 Costa Rica
-
 Cote d'Ivoire
-
 Croatia
-
 Cuba
Cuba
-
 Cyprus
-
 Czechia
-
 DR Congo
-
 Denmark
-
 Dominican Republic
-
 Ecuador
-
 Egypt
Egypt
-
 El Salvador
-
 Estonia
-
 Eswatini
-
 Ethiopia
-
 Finland
-
 France
-
 Georgia
-
 Germany
-
 Ghana
Ghana
-
 Greece
-
 Haiti
Haiti
-
 Hong Kong
-
 Hungary
-
 India
India
-
 Indonesia
-
 Iran, Islamic republic
-
 Iraq
Iraq
-
 Ireland
-
 Israel
-
 Italy
Italy
-
 Jamaica
-
 Japan
Japan
-
 Jordan
-
 Kazakhstan
-
 Kenya
Kenya
-
 Korea
Korea
-
 Kuwait
-
 Kyrgyzstan
-
 Laos
Laos
-
 Latvia
-
 Lebanon
-
 Lesotho
-
 Libya
Libya
-
 Lithuania
-
 Luxembourg
-
 Madagascar
-
 Malaysia
-
 Malta
Malta
-
 Mauritius
-
 Mexico
-
 Moldova
-
 Mongolia
-
 Montenegro
-
 Morocco
-
 Mozambique
-
 Myanmar
-
 Namibia
-
 Nepal
Nepal
-
 Netherlands
-
 New Zealand
-
 Nigeria
-
 North Macedonia
-
 Norway
-
 Oman
Oman
-
 Pakistan
-
 Palestine
-
 Panama
-
 Papua New Guinea
-
 Paraguay
-
 Peru
Peru
-
 Philippines
-
 Poland
-
 Portugal
-
 Puerto Rico
-
 Qatar
Qatar
-
 Reunion
-
 Romania
-
 Rwanda
-
 Saudi Arabia
-
 Serbia
-
 Singapore
-
 Slovakia
-
 Slovenia
-
 Somalia
-
 South Africa
-
 Spain
Spain
-
 Sri Lanka
-
 Sweden
-
 Switzerland
-
 Syria
Syria
-
 Taiwan
-
 Tajikistan
-
 Tanzania
-
 Thailand
-
 Trinidad and Tobago
-
 Tunisia
-
 Turkey
-
 UAE
UAE
-
 Uganda
-
 Ukraine
-
 United Kingdom
-
United States
-
 Uruguay
-
 Uzbekistan
-
 Venezuela
-
 Vietnam
-
 Yemen
Yemen
-
 Zambia
-
 Zimbabwe
- Forex
- Crypto
