
-7.01% for Bonk — moving averages align with intraday downtrend

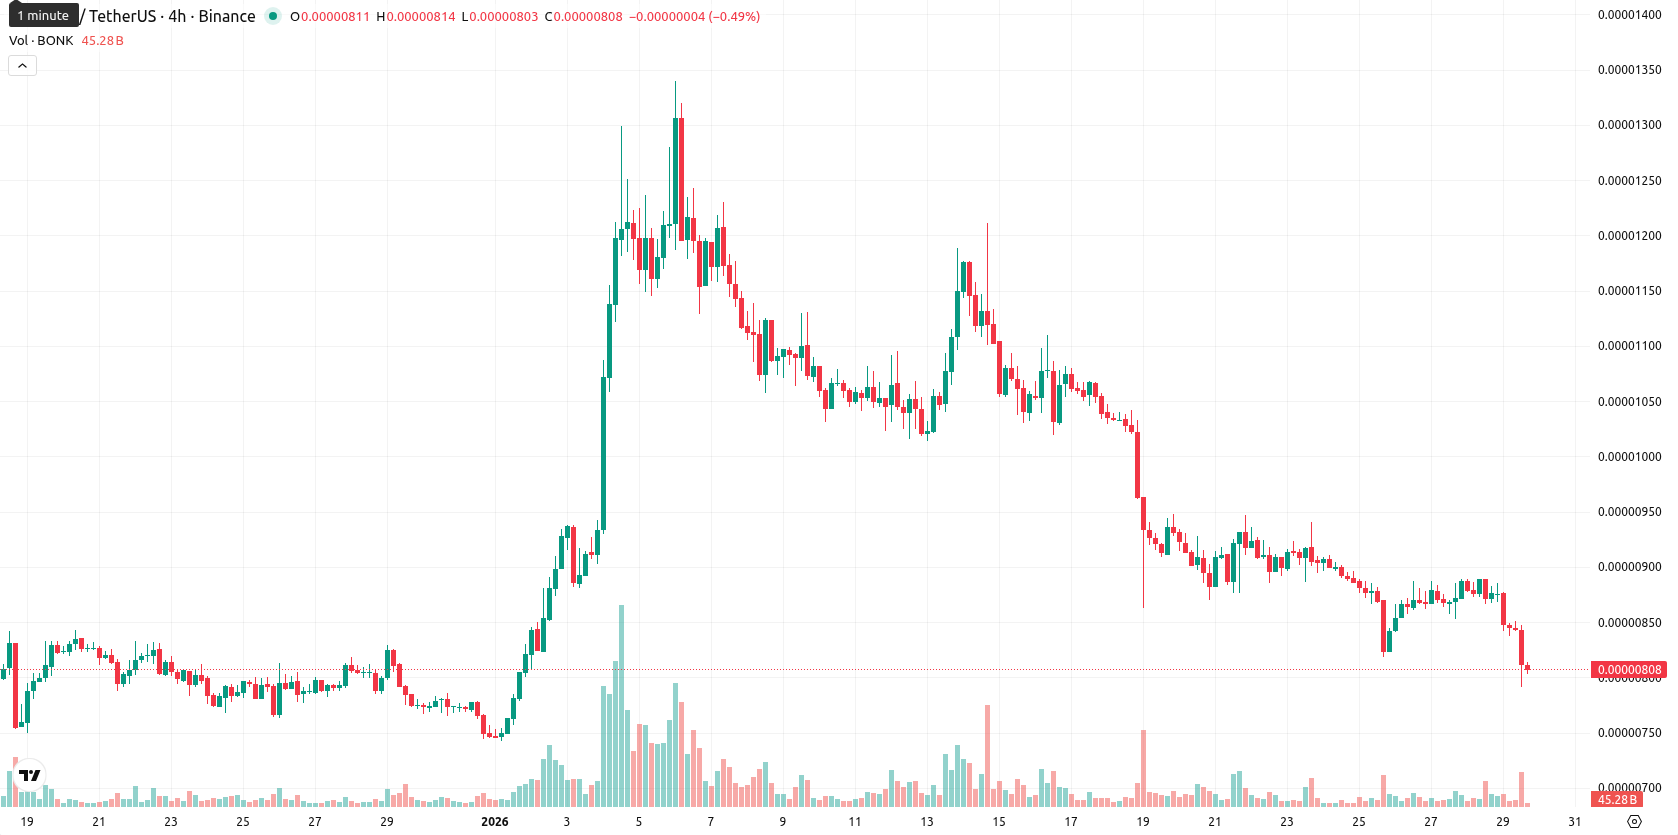
Bonk (BONK) is trading at $0.0000081, having declined 7.01% intraday and currently holding near the daily lows. The token sits below its MA-20 at $0.00000974, MA-50 at $0.00000925, and MA-200 at $0.00001697, indicating persistent seller pressure and a negative bias across all observed timeframes.
Highlights
- BONK trades at $0.0000081, below all major moving averages (MA-20: $0.00000974, MA-50: $0.00000925, MA-200: $0.00001697), signaling sustained bearish pressure.
- Bearish momentum dominates the daily chart, with MACD and ADX confirming a downtrend, RSI below 50, and Awesome Oscillator direction negative.
- Expected five-day price range is $0.00000780 to $0.00000975; probability of a rebound is under 20% with key support at $0.00000780.
Bearish momentum prevails as indicators and moving averages align lower
From a technical standpoint, Bonk faces ongoing downside momentum. The nearest dynamic resistance is at the Ichimoku Kijun level of $0.00001079, while price action remains under the 20-, 50-, and 200-day moving averages. Momentum indicators show prevailing bearishness: both MACD and ADX confirm an active downtrend, with RSI below 50 and Commodity Channel Index maintaining negative territory. No clear oversold signal has emerged; the Stochastic RSI is neutral but continues to trend lower. Bull/Bear Power remains negative and the Awesome Oscillator direction supports bearish sentiment, confirming sellers' dominance throughout intraday trading.
Further declines likely as rebound odds remain subdued amid volatility
For the coming five sessions, typical volatility is expected to keep BONK trading between $0.00000780 and $0.00000975. The likelihood of a meaningful rebound is estimated at less than 20%, so further downside or range-bound consolidation is the primary expectation. A break above $0.00000975 could trigger a bullish scenario, but present technicals point to low odds. Should BONK fall decisively below $0.00000780, accelerated selling is likely.
Previously it was reported that Bonk remains under sustained selling pressure, trading well below the 20-, 50-, and 200-day moving averages, with sellers dominating near session lows as volatility rises. Technical indicators highlight mixed momentum—MACD neutral, ADX mildly positive, but with consistent oversold readings on RSI and Stoch RSI—suggesting limited prospects for a rebound and likely sideways consolidation in the near term unless a break above key resistance occurs.


Latest Bonk News


-
 Afghanistan
-
 Albania
-
 Algeria
-
 Angola
-
 Argentina
-
 Armenia
-
 Australia
-
 Austria
-
 Azerbaijan
-
 Bahamas
-
 Bahrain
-
 Bangladesh
-
 Belarus
-
 Belgium
-
 Bolivia
-
 Botswana
-
 Brazil
-
 Brunei
-
 Bulgaria
-
 Cambodia
-
 Cameroon
-
 Canada
-
 Chile
Chile
-
 China
China
-
 Colombia
-
 Congo
Congo
-
 Costa Rica
-
 Cote d'Ivoire
-
 Croatia
-
 Cuba
Cuba
-
 Cyprus
-
 Czechia
-
 DR Congo
-
 Denmark
-
 Dominican Republic
-
 Ecuador
-
 Egypt
Egypt
-
 El Salvador
-
 Estonia
-
 Eswatini
-
 Ethiopia
-
 Finland
-
 France
-
 Georgia
-
 Germany
-
 Ghana
Ghana
-
 Greece
-
 Haiti
Haiti
-
 Hong Kong
-
 Hungary
-
 India
India
-
 Indonesia
-
 Iran, Islamic republic
-
 Iraq
Iraq
-
 Ireland
-
 Israel
-
 Italy
Italy
-
 Jamaica
-
 Japan
Japan
-
 Jordan
-
 Kazakhstan
-
 Kenya
Kenya
-
 Korea
Korea
-
 Kuwait
-
 Kyrgyzstan
-
 Laos
Laos
-
 Latvia
-
 Lebanon
-
 Lesotho
-
 Libya
Libya
-
 Lithuania
-
 Luxembourg
-
 Madagascar
-
 Malaysia
-
 Malta
Malta
-
 Mauritius
-
 Mexico
-
 Moldova
-
 Mongolia
-
 Montenegro
-
 Morocco
-
 Mozambique
-
 Myanmar
-
 Namibia
-
 Nepal
Nepal
-
 Netherlands
-
 New Zealand
-
 Nigeria
-
 North Macedonia
-
 Norway
-
 Oman
Oman
-
 Pakistan
-
 Palestine
-
 Panama
-
 Papua New Guinea
-
 Paraguay
-
 Peru
Peru
-
 Philippines
-
 Poland
-
 Portugal
-
 Puerto Rico
-
 Qatar
Qatar
-
 Reunion
-
 Romania
-
 Rwanda
-
 Saudi Arabia
-
 Serbia
-
 Singapore
-
 Slovakia
-
 Slovenia
-
 Somalia
-
 South Africa
-
 Spain
Spain
-
 Sri Lanka
-
 Sweden
-
 Switzerland
-
 Syria
Syria
-
 Taiwan
-
 Tajikistan
-
 Tanzania
-
 Thailand
-
 Trinidad and Tobago
-
 Tunisia
-
 Turkey
-
 UAE
UAE
-
 Uganda
-
 Ukraine
-
 United Kingdom
-
United States
-
 Uruguay
-
 Uzbekistan
-
 Venezuela
-
 Vietnam
-
 Yemen
Yemen
-
 Zambia
-
 Zimbabwe
- Forex
- Crypto
