
NEAR falls as sellers maintain control below key moving averages

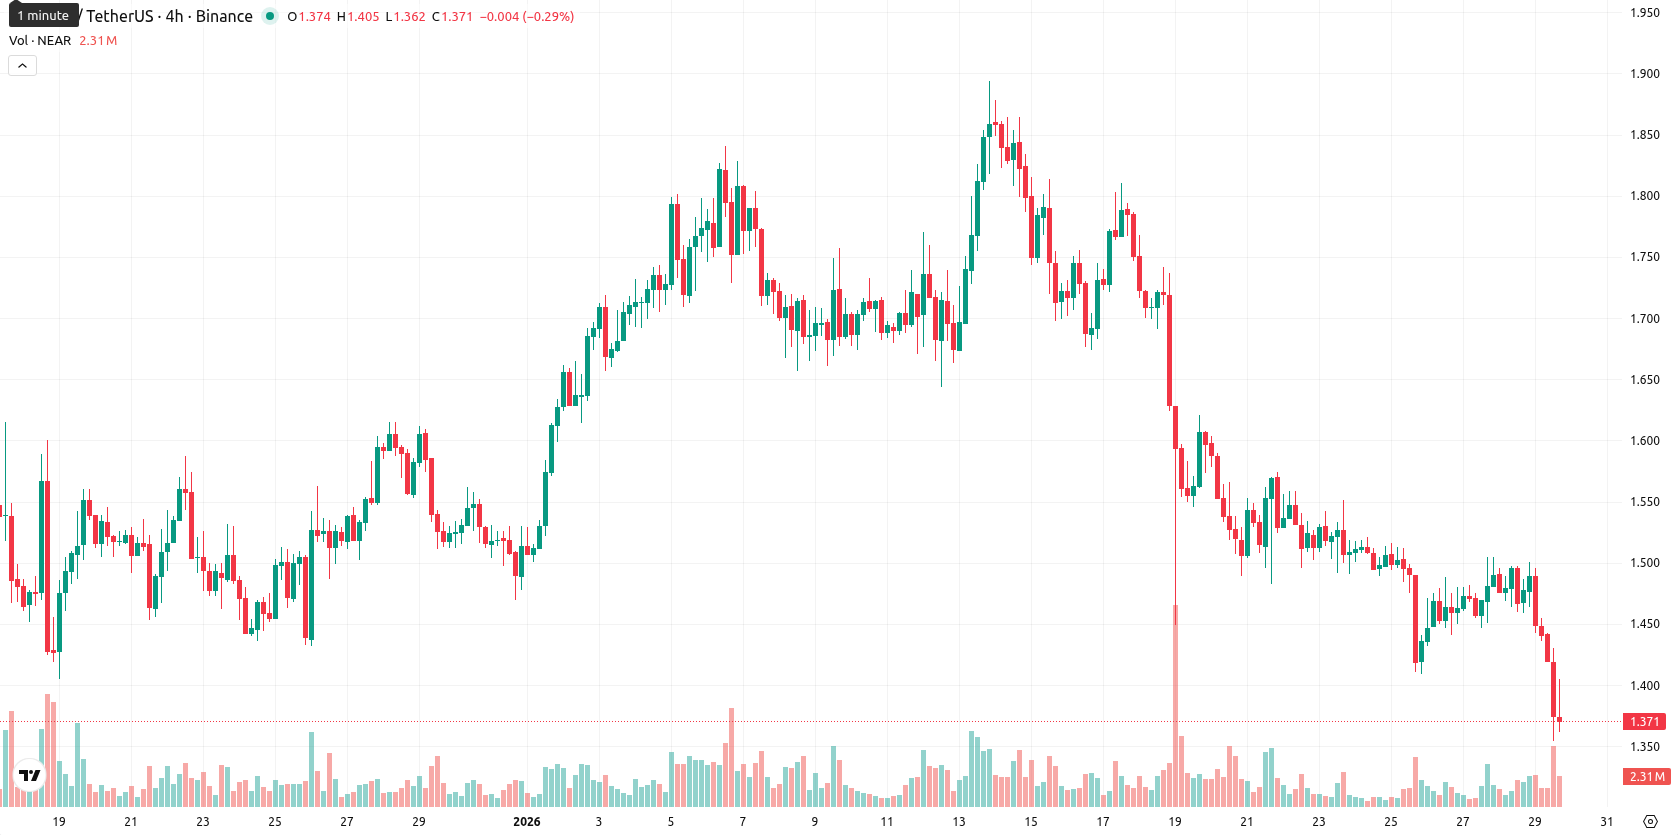
NEAR (NEAR) is trading at $1.3666, marking a daily drop both in absolute terms and percentage. The asset remains below its MA-20, MA-50, and MA-200, indicating overall selling pressure relative to key moving averages.
Highlights
- NEAR is trading at $1.3666, below the MA-20 ($1.6151), MA-50 ($1.6021), and MA-200 ($2.2683), confirming sustained bearish pressure across all timeframes.
- MACD and Awesome Oscillator are negative, RSI (40.43) and CCI (-78.29) are mildly oversold, while ADX at 17.16 signals a weak overall trend.
- NEAR faces dynamic resistance at $1.6515 (Ichimoku Kijun); as long as price remains under $1.23, further declines are likely, with a low probability of bullish reversal.
Seller dominance persists amid weak momentum and failed recovery
The current price of NEAR ($1.3666) stands below the MA-20 ($1.6151), MA-50 ($1.6021), and well beneath the MA-200 ($2.2683), signaling that short-, medium-, and long-term trends remain under seller dominance. The next significant dynamic resistance aligns with the Ichimoku Kijun at $1.6515, while the absence of a Golden or Death Cross means no additional long-term signal is present. Momentum, as measured by the MACD, continues weak with a Sell reading, while the ADX at 17.16 indicates a lack of strong trend strength. Both the RSI (40.43) and CCI (-78.29) suggest mild oversold conditions, confirmed by the Stochastic RSI, which is near the oversold threshold. Bull/Bear Power displays negative values and a Sell bias, underscoring active seller dominance during intraday moves. The Awesome Oscillator is also negative, reinforcing this downward momentum. The trading session opened at $1.4924, only slightly above the prior close of $1.484, showing no significant gap. Price now sits near the low of today’s range ($1.354–$1.4962), following a high-volatility session marked by a 7.91% decline. Intraday tone shows persistent selling pressure after the open, with no notable recovery attempts.
Further declines likely as bearish signals limit upside scenarios
Looking to the next five trading days, the expected price range is normalized around $1.23 to $1.50 to reflect recent volatility and the position of the current price. There is a very low probability (less than 20%) of a sustained price increase, while a further decline is far more likely given the uniformly bearish signals from weekly and daily Moving Averages, RSI, and MACD. The baseline scenario sees NEAR consolidating in a sideways corridor between $1.23 and $1.50. A bullish scenario requires a move above $1.65 resistance, which appears unlikely given current momentum. In a bearish scenario, a decisive break below $1.23 could trigger further downside, as sellers remain firmly in control.
Previously it was reported that NEAR continues to trade below key weekly moving averages, with technical indicators such as the RSI, MACD, and CCI confirming persistent bearish momentum and oversold conditions. With support levels lacking and resistance defined near the Ichimoku Kijun, NEAR is expected to consolidate in a narrow range, maintaining a bearish bias and exposing the asset to further downside risk.


Latest NEAR News


-
 Afghanistan
-
 Albania
-
 Algeria
-
 Angola
-
 Argentina
-
 Armenia
-
 Australia
-
 Austria
-
 Azerbaijan
-
 Bahamas
-
 Bahrain
-
 Bangladesh
-
 Belarus
-
 Belgium
-
 Bolivia
-
 Botswana
-
 Brazil
-
 Brunei
-
 Bulgaria
-
 Cambodia
-
 Cameroon
-
 Canada
-
 Chile
Chile
-
 China
China
-
 Colombia
-
 Congo
Congo
-
 Costa Rica
-
 Cote d'Ivoire
-
 Croatia
-
 Cuba
Cuba
-
 Cyprus
-
 Czechia
-
 DR Congo
-
 Denmark
-
 Dominican Republic
-
 Ecuador
-
 Egypt
Egypt
-
 El Salvador
-
 Estonia
-
 Eswatini
-
 Ethiopia
-
 Finland
-
 France
-
 Georgia
-
 Germany
-
 Ghana
Ghana
-
 Greece
-
 Haiti
Haiti
-
 Hong Kong
-
 Hungary
-
 India
India
-
 Indonesia
-
 Iran, Islamic republic
-
 Iraq
Iraq
-
 Ireland
-
 Israel
-
 Italy
Italy
-
 Jamaica
-
 Japan
Japan
-
 Jordan
-
 Kazakhstan
-
 Kenya
Kenya
-
 Korea
Korea
-
 Kuwait
-
 Kyrgyzstan
-
 Laos
Laos
-
 Latvia
-
 Lebanon
-
 Lesotho
-
 Libya
Libya
-
 Lithuania
-
 Luxembourg
-
 Madagascar
-
 Malaysia
-
 Malta
Malta
-
 Mauritius
-
 Mexico
-
 Moldova
-
 Mongolia
-
 Montenegro
-
 Morocco
-
 Mozambique
-
 Myanmar
-
 Namibia
-
 Nepal
Nepal
-
 Netherlands
-
 New Zealand
-
 Nigeria
-
 North Macedonia
-
 Norway
-
 Oman
Oman
-
 Pakistan
-
 Palestine
-
 Panama
-
 Papua New Guinea
-
 Paraguay
-
 Peru
Peru
-
 Philippines
-
 Poland
-
 Portugal
-
 Puerto Rico
-
 Qatar
Qatar
-
 Reunion
-
 Romania
-
 Rwanda
-
 Saudi Arabia
-
 Serbia
-
 Singapore
-
 Slovakia
-
 Slovenia
-
 Somalia
-
 South Africa
-
 Spain
Spain
-
 Sri Lanka
-
 Sweden
-
 Switzerland
-
 Syria
Syria
-
 Taiwan
-
 Tajikistan
-
 Tanzania
-
 Thailand
-
 Trinidad and Tobago
-
 Tunisia
-
 Turkey
-
 UAE
UAE
-
 Uganda
-
 Ukraine
-
 United Kingdom
-
United States
-
 Uruguay
-
 Uzbekistan
-
 Venezuela
-
 Vietnam
-
 Yemen
Yemen
-
 Zambia
-
 Zimbabwe
- Forex
- Crypto
