
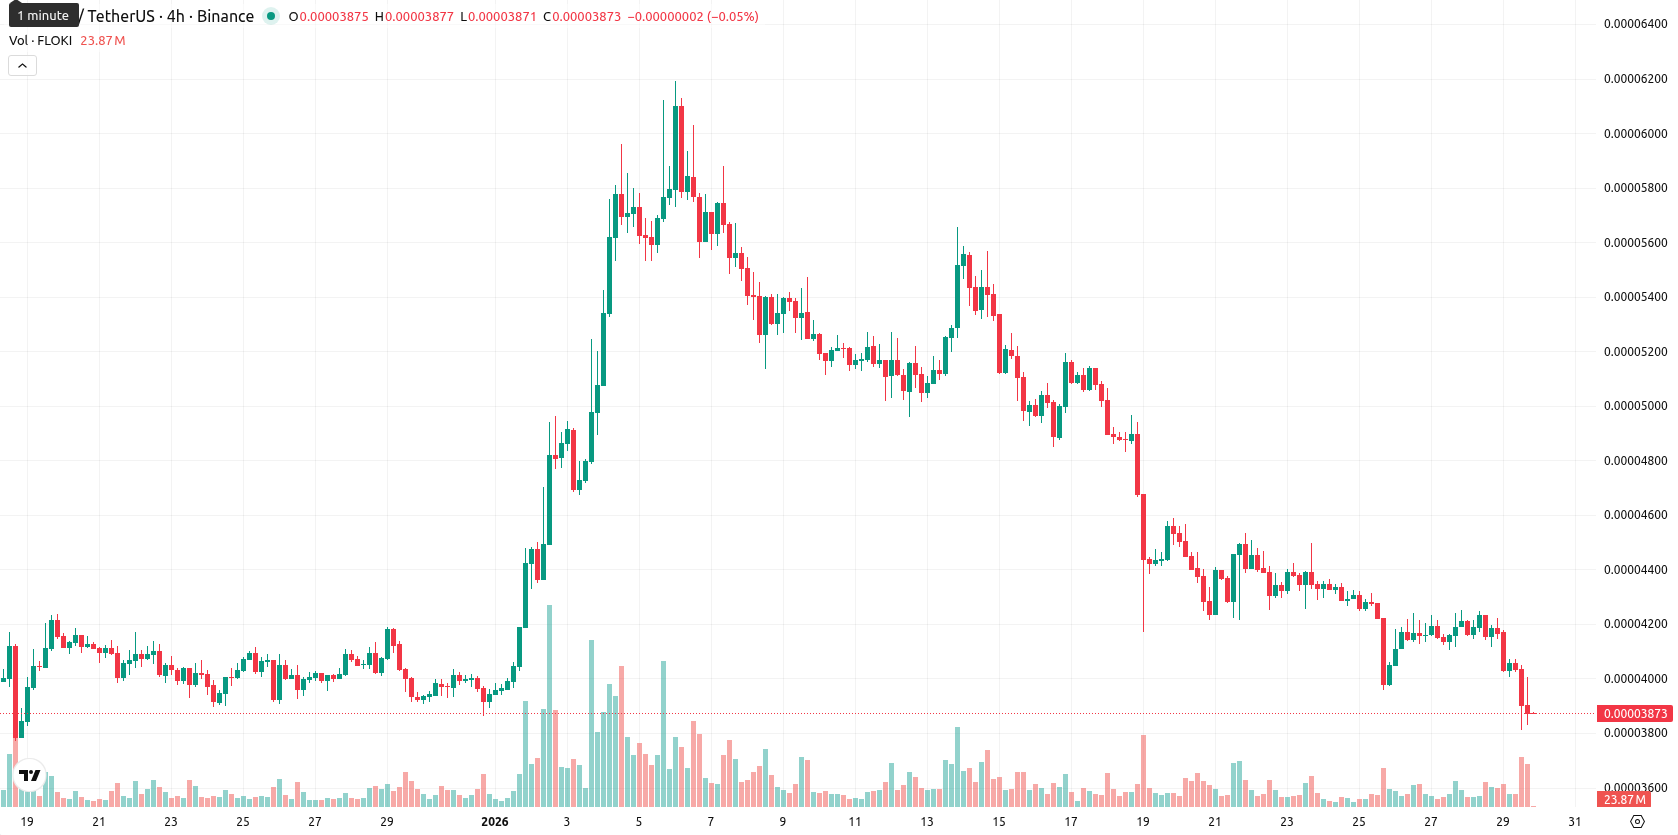
Floki slips 7.14% as momentum indicators support sellers

Floki (FLOKI) is trading at $0.000039 with a daily decline of 7.14%, placing it below the MA-20 ($0.00004702), MA-50 ($0.00004575), and MA-200 ($0.00007602) averages. The asset remains under persistent selling pressure, currently sitting well beneath key resistance levels and within the lower portion of today's volatile range.
Highlights
- FLOKI trades at $0.000039, well below MA-20 ($0.00004702), MA-50 ($0.00004575), and MA-200 ($0.00007602), indicating persistent multi-timeframe selling pressure.
- Momentum indicators including MACD, ADX, RSI (39.69), and CCI (-82) all issue Sell signals, showing dominant bearish sentiment with oversold but not extreme conditions.
- Immediate resistance is at the Ichimoku Kijun level of $0.00005076; failure to hold above $0.0000388 may trigger further declines, as all short-term signals remain bearish.
Bearish technical signals as momentum and resistance levels align
The technical setup for FLOKI remains bearish as the price trades below important short-, medium-, and long-term moving averages, with the Ichimoku Kijun level at $0.00005076 acting as the nearest dynamic resistance. Momentum indicators reinforce the downward bias: the MACD and ADX present Sell signals, the RSI at 39.69 and Stochastic RSI near 21 signal oversold but not extreme conditions, and the CCI reads -82. Bull/Bear Power highlights ongoing seller dominance, with the Awesome Oscillator confirming broader weakness.
Ongoing downside risk as volatility bands favor sellers
Over the next five trading days, FLOKI is expected to oscillate in a typical volatility band between $0.0000388 and $0.0000430. Downside momentum is likely to persist, with a less than 20% chance of a bullish reversal in the short term, as all key weekly technicals favor sellers. A close below $0.0000388 would increase the risk of further declines, while bullish momentum would require a break above the Ichimoku resistance at $0.00005076.
Previously it was reported that Floki Inu is trading well below key moving averages, with all major technical indicators—including RSI, MACD, and momentum oscillators—signaling sustained bearish pressure and deepening oversold conditions. Immediate resistance is identified at the Ichimoku Kijun, support remains untested, and the overall outlook suggests continued downside risk with price likely to remain under pressure in the near term.


-
 Afghanistan
-
 Albania
-
 Algeria
-
 Angola
-
 Argentina
-
 Armenia
-
 Australia
-
 Austria
-
 Azerbaijan
-
 Bahamas
-
 Bahrain
-
 Bangladesh
-
 Belarus
-
 Belgium
-
 Bolivia
-
 Botswana
-
 Brazil
-
 Brunei
-
 Bulgaria
-
 Cambodia
-
 Cameroon
-
 Canada
-
 Chile
Chile
-
 China
China
-
 Colombia
-
 Congo
Congo
-
 Costa Rica
-
 Cote d'Ivoire
-
 Croatia
-
 Cuba
Cuba
-
 Cyprus
-
 Czechia
-
 DR Congo
-
 Denmark
-
 Dominican Republic
-
 Ecuador
-
 Egypt
Egypt
-
 El Salvador
-
 Estonia
-
 Eswatini
-
 Ethiopia
-
 Finland
-
 France
-
 Georgia
-
 Germany
-
 Ghana
Ghana
-
 Greece
-
 Haiti
Haiti
-
 Hong Kong
-
 Hungary
-
 India
India
-
 Indonesia
-
 Iran, Islamic republic
-
 Iraq
Iraq
-
 Ireland
-
 Israel
-
 Italy
Italy
-
 Jamaica
-
 Japan
Japan
-
 Jordan
-
 Kazakhstan
-
 Kenya
Kenya
-
 Korea
Korea
-
 Kuwait
-
 Kyrgyzstan
-
 Laos
Laos
-
 Latvia
-
 Lebanon
-
 Lesotho
-
 Libya
Libya
-
 Lithuania
-
 Luxembourg
-
 Madagascar
-
 Malaysia
-
 Malta
Malta
-
 Mauritius
-
 Mexico
-
 Moldova
-
 Mongolia
-
 Montenegro
-
 Morocco
-
 Mozambique
-
 Myanmar
-
 Namibia
-
 Nepal
Nepal
-
 Netherlands
-
 New Zealand
-
 Nigeria
-
 North Macedonia
-
 Norway
-
 Oman
Oman
-
 Pakistan
-
 Palestine
-
 Panama
-
 Papua New Guinea
-
 Paraguay
-
 Peru
Peru
-
 Philippines
-
 Poland
-
 Portugal
-
 Puerto Rico
-
 Qatar
Qatar
-
 Reunion
-
 Romania
-
 Rwanda
-
 Saudi Arabia
-
 Serbia
-
 Singapore
-
 Slovakia
-
 Slovenia
-
 Somalia
-
 South Africa
-
 Spain
Spain
-
 Sri Lanka
-
 Sweden
-
 Switzerland
-
 Syria
Syria
-
 Taiwan
-
 Tajikistan
-
 Tanzania
-
 Thailand
-
 Trinidad and Tobago
-
 Tunisia
-
 Turkey
-
 UAE
UAE
-
 Uganda
-
 Ukraine
-
 United Kingdom
-
United States
-
 Uruguay
-
 Uzbekistan
-
 Venezuela
-
 Vietnam
-
 Yemen
Yemen
-
 Zambia
-
 Zimbabwe
- Forex
- Crypto
