
Kaia: Bearish signals and resistance cap further losses

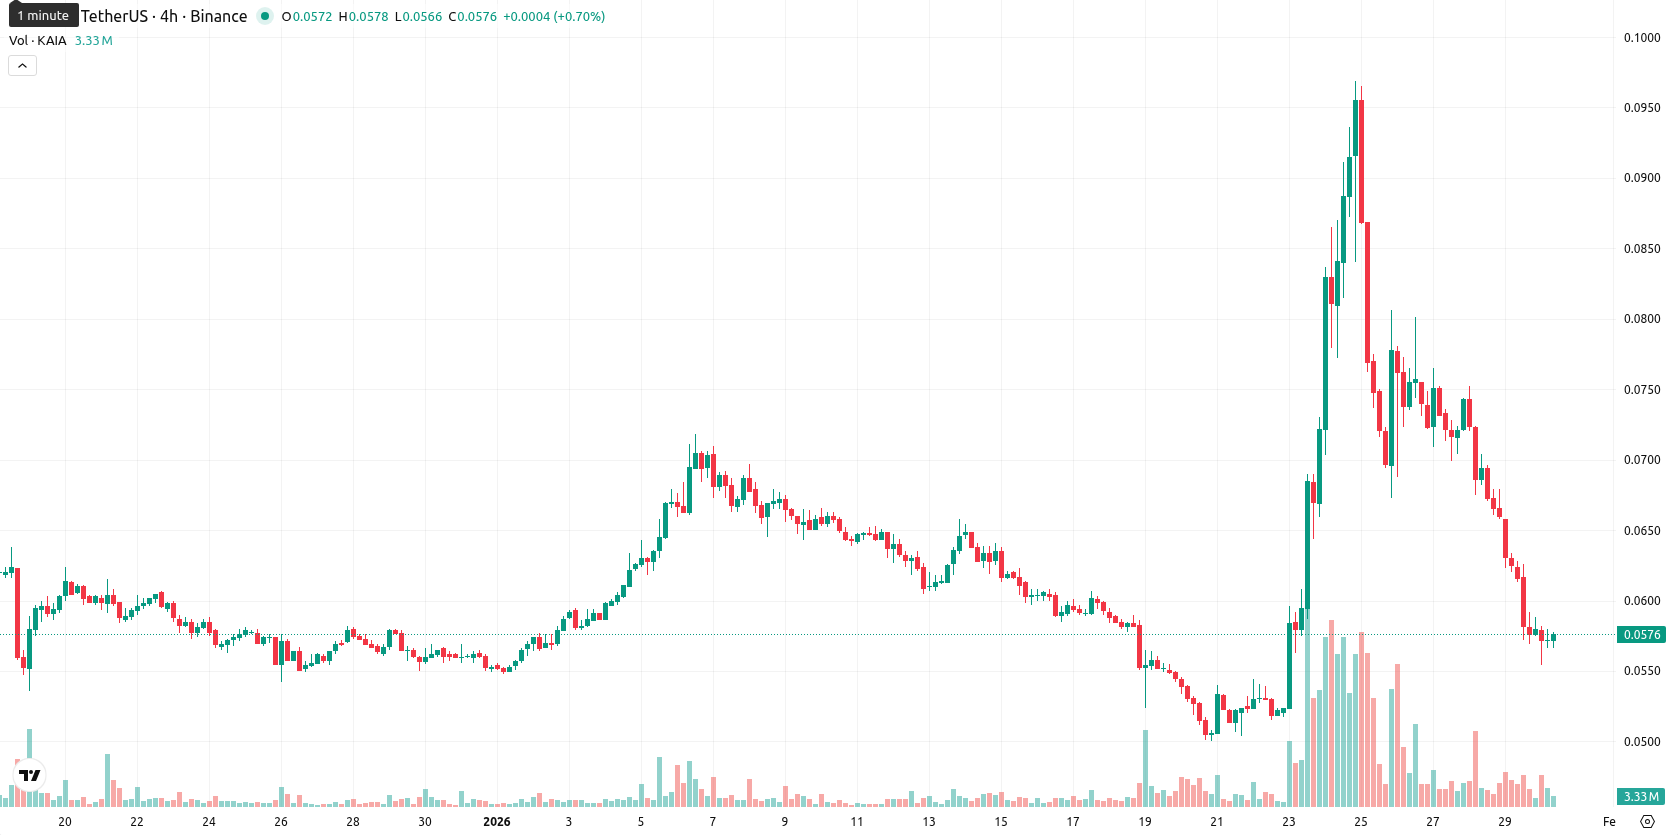
Kaia (KAIA) is trading well below the MA-20 ($0.0639), MA-50 ($0.0633), and MA-200 ($0.1124), indicating persistent downward pressure across all timeframes. The asset began the day near its lows, deep within the $0.0554 – $0.0581 range, reflecting an 8.01% daily decline and sustained negative intraday volatility.
Highlights
- KAIA is trading well below its MA-20 ($0.0639), MA-50 ($0.0633), and MA-200 ($0.1124), signaling sustained short-, medium-, and long-term downward pressure.
- Momentum indicators are mixed: daily MACD and ADX hint at bullish strength, while RSI at 45.55 and neutral oscillators underscore a lack of oversold or overbought conditions.
- The next five-day trading range is projected at $0.0555 to $0.0598, with further declines more likely unless price breaks above Ichimoku resistance at $0.0735.
Seller control persists as mixed momentum meets weak support
Technical analysis indicates the nearest dynamic resistance is set by the Ichimoku Kijun at $0.0735, and there is only minor support just above current levels. The daily MACD and ADX show some bullish momentum, but RSI at 45.55 and a neutral Stochastic RSI suggest the asset is neither overbought nor oversold. The Commodity Channel Index is neutral, while Bull/Bear Power points to continued seller dominance. Despite the mixed signals from oscillators, price action and intraday tone confirm ongoing bearish strength.
Further downside likely as volatility narrows and resistance holds
Looking ahead to the next five trading days, KAIA is expected to remain within a typical volatility band of $0.0555 to $0.0598. The probability of a price rise is very low (less than 20%), so further declines remain the more likely scenario. A sideways movement is anticipated within this corridor, with a bullish breakout only possible above the Ichimoku resistance at $0.0735. If the price closes and sustains below $0.0555, a deeper bearish move is likely due to persistent selling pressure.
Last time, analysts noted that Kaia (KAIA) is trading under its key moving averages, with the current price experiencing sharp downside pressure and high volatility. Daily momentum signals such as MACD and ADX are mildly bullish, but persistent intraday selling, a neutral daily RSI, and declining weekly RSI reinforce a dominant bearish trend capped by resistance near the Ichimoku Kijun.


-
 Afghanistan
-
 Albania
-
 Algeria
-
 Angola
-
 Argentina
-
 Armenia
-
 Australia
-
 Austria
-
 Azerbaijan
-
 Bahamas
-
 Bahrain
-
 Bangladesh
-
 Belarus
-
 Belgium
-
 Bolivia
-
 Botswana
-
 Brazil
-
 Brunei
-
 Bulgaria
-
 Cambodia
-
 Cameroon
-
 Canada
-
 Chile
Chile
-
 China
China
-
 Colombia
-
 Congo
Congo
-
 Costa Rica
-
 Cote d'Ivoire
-
 Croatia
-
 Cuba
Cuba
-
 Cyprus
-
 Czechia
-
 DR Congo
-
 Denmark
-
 Dominican Republic
-
 Ecuador
-
 Egypt
Egypt
-
 El Salvador
-
 Estonia
-
 Eswatini
-
 Ethiopia
-
 Finland
-
 France
-
 Georgia
-
 Germany
-
 Ghana
Ghana
-
 Greece
-
 Haiti
Haiti
-
 Hong Kong
-
 Hungary
-
 India
India
-
 Indonesia
-
 Iran, Islamic republic
-
 Iraq
Iraq
-
 Ireland
-
 Israel
-
 Italy
Italy
-
 Jamaica
-
 Japan
Japan
-
 Jordan
-
 Kazakhstan
-
 Kenya
Kenya
-
 Korea
Korea
-
 Kuwait
-
 Kyrgyzstan
-
 Laos
Laos
-
 Latvia
-
 Lebanon
-
 Lesotho
-
 Libya
Libya
-
 Lithuania
-
 Luxembourg
-
 Madagascar
-
 Malaysia
-
 Malta
Malta
-
 Mauritius
-
 Mexico
-
 Moldova
-
 Mongolia
-
 Montenegro
-
 Morocco
-
 Mozambique
-
 Myanmar
-
 Namibia
-
 Nepal
Nepal
-
 Netherlands
-
 New Zealand
-
 Nigeria
-
 North Macedonia
-
 Norway
-
 Oman
Oman
-
 Pakistan
-
 Palestine
-
 Panama
-
 Papua New Guinea
-
 Paraguay
-
 Peru
Peru
-
 Philippines
-
 Poland
-
 Portugal
-
 Puerto Rico
-
 Qatar
Qatar
-
 Reunion
-
 Romania
-
 Rwanda
-
 Saudi Arabia
-
 Serbia
-
 Singapore
-
 Slovakia
-
 Slovenia
-
 Somalia
-
 South Africa
-
 Spain
Spain
-
 Sri Lanka
-
 Sweden
-
 Switzerland
-
 Syria
Syria
-
 Taiwan
-
 Tajikistan
-
 Tanzania
-
 Thailand
-
 Trinidad and Tobago
-
 Tunisia
-
 Turkey
-
 UAE
UAE
-
 Uganda
-
 Ukraine
-
 United Kingdom
-
United States
-
 Uruguay
-
 Uzbekistan
-
 Venezuela
-
 Vietnam
-
 Yemen
Yemen
-
 Zambia
-
 Zimbabwe
- Forex
- Crypto
