
-7.17% for VeChain — high volatility and seller control after session open

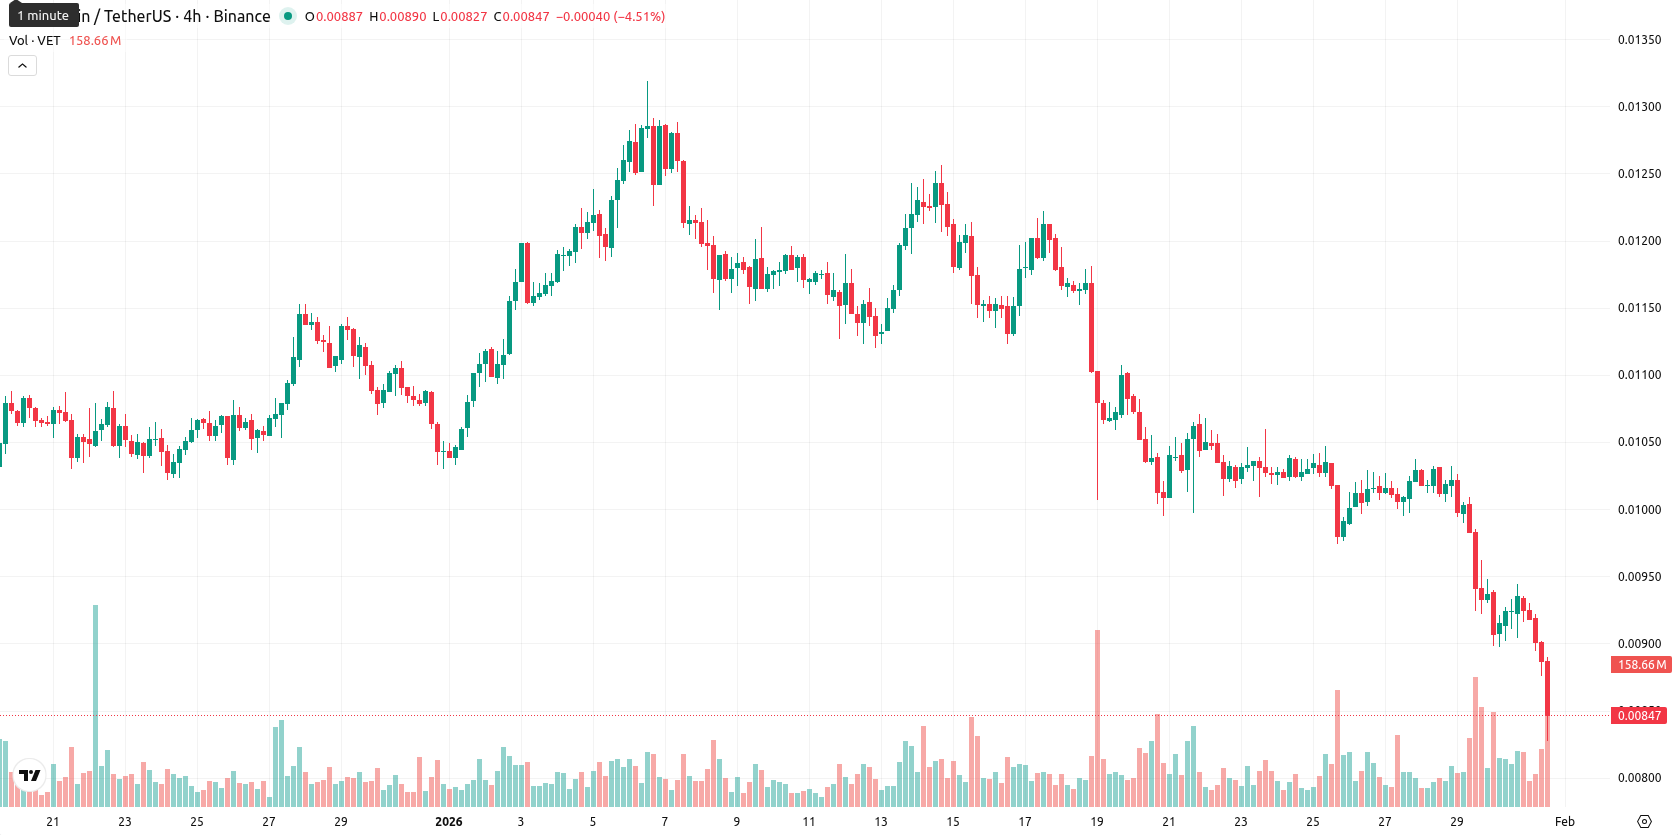
VeChain (VET) is trading at $0.008522, which is notably below the MA-20 ($0.01072650), MA-50 ($0.01098860), and MA-200 ($0.01817895), indicating persistent selling pressure across short-, medium-, and long-term trends. The nearest dynamic resistance on the daily timeframe is located at the Ichimoku Kijun level of $0.011082; with the price well below this threshold, upside attempts face notable resistance, while there is no immediate dynamic support from Ichimoku within range.
Highlights
- VeChain (VET) trades at $0.008522, well below its MA-20, MA-50, and MA-200 levels, indicating persistent selling pressure across all time frames.
- Daily momentum readings remain negative, with the MACD, ADX, and oscillators such as RSI (31.66) and CCI (–137.03) confirming a strong bearish trend and oversold conditions.
- Price is projected to remain between $0.00830 and $0.00930 over the next five days, with high probability of continued weakness unless a breakout above $0.00930 occurs.
Oversold technicals intensify as sellers dominate with heavy volatility
Momentum readings are negative, with the daily MACD and ADX both confirming a bearish trend. Oscillators such as the daily RSI (31.66), Stochastic RSI (oversold), and CCI (oversold at –137.03) show the asset moving into oversold territory, pointing to elevated downside exhaustion. Bull/Bear Power presents a clear “sell” bias, reflecting intraday seller dominance, while the Awesome Oscillator also supports the bearish momentum. The current price is near the session low within today's range of $0.00828 – $0.009253, following a 7.17% decline from a relatively steady open with no significant gap from the previous close. Intraday volatility is high, and the tone remains heavy as bears maintain control following the session’s open; momentum and oscillators are clearly aligned to the downside.
Sustained bearish probability as resistance caps rebound potential
For the next five trading days, the expected price range is projected between $0.00830 and $0.00930. There is a very high probability (more than 80%) of continued price weakness, with a price increase being less likely given that all key weekly indicators — MA-50, RSI, ADX, and MACD — reflect persistent bearish signals. In the baseline scenario, VET may remain trapped in a sideways corridor within this volatility band. A bullish scenario would require a breakout above the $0.00930 resistance zone, potentially targeting the Ichimoku Kijun near $0.01108. Conversely, a bearish scenario unfolds if the price falls below $0.00830, opening risks of further decline as oversold conditions persist.
Previously it was reported that VeChain continues to trade significantly below all major moving averages, with persistent downward momentum confirmed by bearish MACD, strong ADX, and multiple oversold oscillators including RSI and Stochastic RSI. Immediate resistance remains at the Ichimoku kijun, and the absence of nearby technical support alongside high volatility and heavy intraday selling suggests further declines may be likely in the short term.


Latest VeChain News


-
 Afghanistan
-
 Albania
-
 Algeria
-
 Angola
-
 Argentina
-
 Armenia
-
 Australia
-
 Austria
-
 Azerbaijan
-
 Bahamas
-
 Bahrain
-
 Bangladesh
-
 Belarus
-
 Belgium
-
 Bolivia
-
 Botswana
-
 Brazil
-
 Brunei
-
 Bulgaria
-
 Cambodia
-
 Cameroon
-
 Canada
-
 Chile
Chile
-
 China
China
-
 Colombia
-
 Congo
Congo
-
 Costa Rica
-
 Cote d'Ivoire
-
 Croatia
-
 Cuba
Cuba
-
 Cyprus
-
 Czechia
-
 DR Congo
-
 Denmark
-
 Dominican Republic
-
 Ecuador
-
 Egypt
Egypt
-
 El Salvador
-
 Estonia
-
 Eswatini
-
 Ethiopia
-
 Finland
-
 France
-
 Georgia
-
 Germany
-
 Ghana
Ghana
-
 Greece
-
 Haiti
Haiti
-
 Hong Kong
-
 Hungary
-
 India
India
-
 Indonesia
-
 Iran, Islamic republic
-
 Iraq
Iraq
-
 Ireland
-
 Israel
-
 Italy
Italy
-
 Jamaica
-
 Japan
Japan
-
 Jordan
-
 Kazakhstan
-
 Kenya
Kenya
-
 Korea
Korea
-
 Kuwait
-
 Kyrgyzstan
-
 Laos
Laos
-
 Latvia
-
 Lebanon
-
 Lesotho
-
 Libya
Libya
-
 Lithuania
-
 Luxembourg
-
 Madagascar
-
 Malaysia
-
 Malta
Malta
-
 Mauritius
-
 Mexico
-
 Moldova
-
 Mongolia
-
 Montenegro
-
 Morocco
-
 Mozambique
-
 Myanmar
-
 Namibia
-
 Nepal
Nepal
-
 Netherlands
-
 New Zealand
-
 Nigeria
-
 North Macedonia
-
 Norway
-
 Oman
Oman
-
 Pakistan
-
 Palestine
-
 Panama
-
 Papua New Guinea
-
 Paraguay
-
 Peru
Peru
-
 Philippines
-
 Poland
-
 Portugal
-
 Puerto Rico
-
 Qatar
Qatar
-
 Reunion
-
 Romania
-
 Rwanda
-
 Saudi Arabia
-
 Serbia
-
 Singapore
-
 Slovakia
-
 Slovenia
-
 Somalia
-
 South Africa
-
 Spain
Spain
-
 Sri Lanka
-
 Sweden
-
 Switzerland
-
 Syria
Syria
-
 Taiwan
-
 Tajikistan
-
 Tanzania
-
 Thailand
-
 Trinidad and Tobago
-
 Tunisia
-
 Turkey
-
 UAE
UAE
-
 Uganda
-
 Ukraine
-
 United Kingdom
-
United States
-
 Uruguay
-
 Uzbekistan
-
 Venezuela
-
 Vietnam
-
 Yemen
Yemen
-
 Zambia
-
 Zimbabwe
- Forex
- Crypto
