
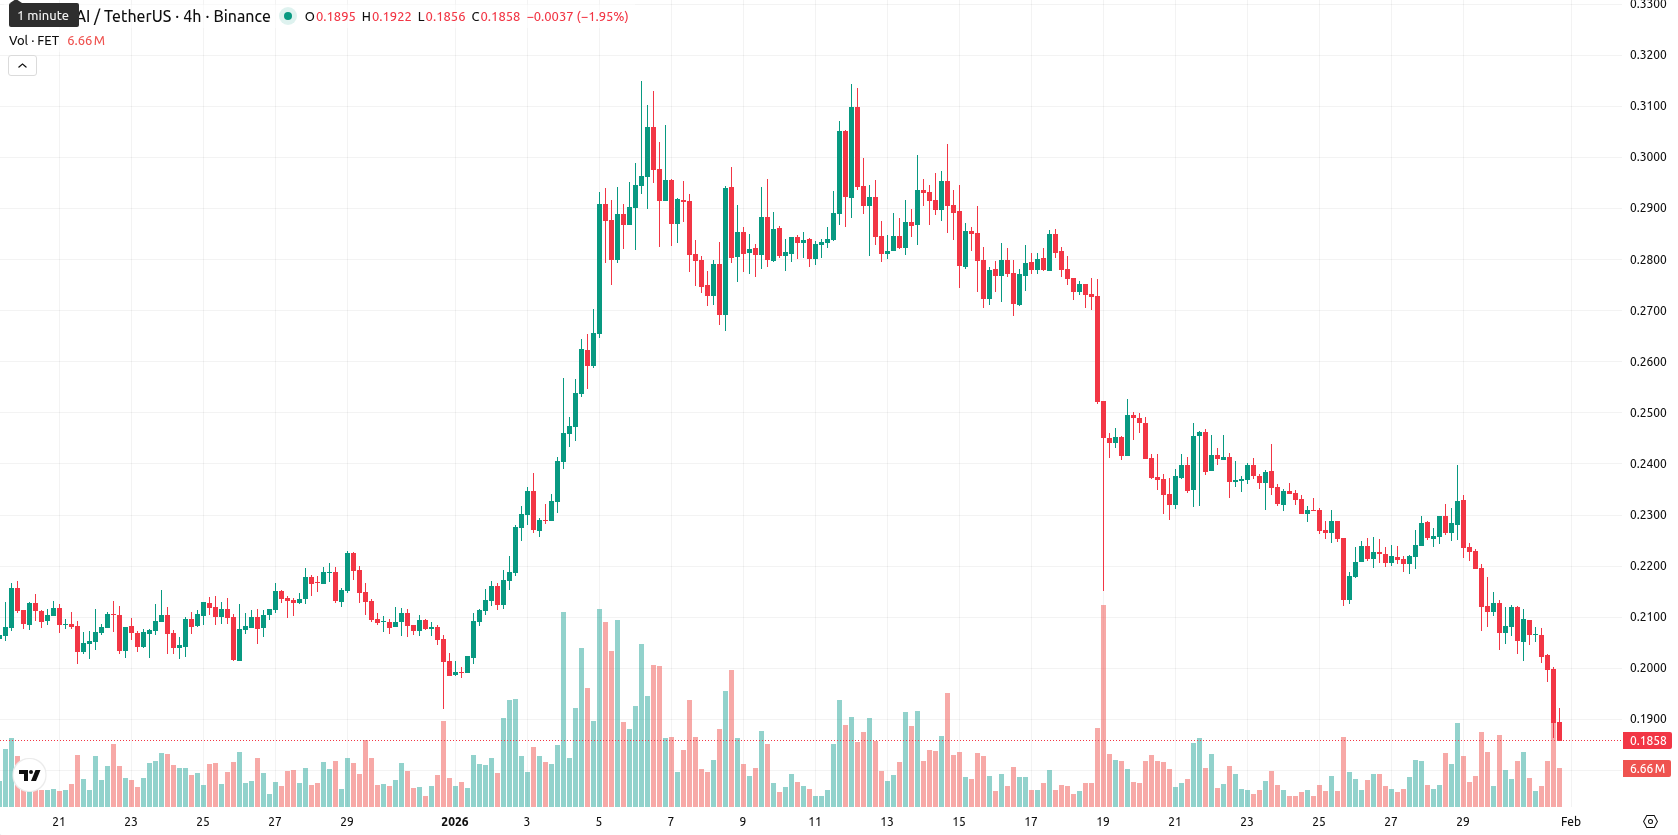
-8.5% for Fetch.ai — sellers dominate with no strong support in sight

Fetch.ai (FET, formerly Artificial Superintelligence Alliance) is trading well below its MA-20 at $0.2490, its MA-50 at $0.2384, and its MA-200 at $0.4337, highlighting persistent seller pressure across all timeframes. The current price sits near today’s low, reflecting high volatility and an ongoing bearish environment after the open.
Highlights
- FET is trading well below its MA-20 ($0.2490), MA-50 ($0.2384), and MA-200 ($0.4337), indicating strong and persistent seller pressure across all timeframes.
- Momentum remains bearish with MACD and ADX signaling sustained weakness, and oscillators such as RSI (34.51), Stochastic RSI (0.0000), and CCI (–111.75) reflecting deeply oversold conditions.
- FET is expected to trade between $0.1828 and $0.2250 for the coming week, with less than 20% probability of price recovery and risk of new lows if $0.1828 is breached.
Bearish momentum sustained as oversold oscillators fail to signal reversal
Momentum remains bearish — both MACD and ADX signal ongoing weakness, with the MACD in negative territory and the ADX showing a lack of trend strength. Oscillators are at or near deeply oversold levels: RSI at 34.51, Stochastic RSI at 0.0000, and CCI at –111.75, all indicating possible seller exhaustion in the short term. However, Bull/Bear Power remains negative, the Awesome Oscillator supports the downtrend, and there is no positive divergence from oscillators. Technical levels show resistance from the Ichimoku Kijun at $0.2582 and no significant support from major moving averages in the current zone.
Further downside risk dominates as volatility band offers little support
For the coming week, FET is expected to remain within the $0.1828 to $0.2250 typical volatility band relative to current levels. The probability of a price increase is very low (less than 20%), leaving further decline as the more likely outcome. The base case scenario anticipates sideways movement inside this range; a bullish setup would require breaking above $0.2250, while a drop below $0.1828 could expose new lows given the lack of nearby support.
Previously it was reported that Fetch.ai is trading below all major moving averages, with persistent bearish momentum confirmed by weak trend strength and oversold indicators across RSI, MACD, and ADX. With sellers maintaining control and technical signals capping rebound potential, the asset is expected to consolidate within a defined range unless a decisive move above resistance occurs.


-
 Afghanistan
-
 Albania
-
 Algeria
-
 Angola
-
 Argentina
-
 Armenia
-
 Australia
-
 Austria
-
 Azerbaijan
-
 Bahamas
-
 Bahrain
-
 Bangladesh
-
 Belarus
-
 Belgium
-
 Bolivia
-
 Botswana
-
 Brazil
-
 Brunei
-
 Bulgaria
-
 Cambodia
-
 Cameroon
-
 Canada
-
 Chile
Chile
-
 China
China
-
 Colombia
-
 Congo
Congo
-
 Costa Rica
-
 Cote d'Ivoire
-
 Croatia
-
 Cuba
Cuba
-
 Cyprus
-
 Czechia
-
 DR Congo
-
 Denmark
-
 Dominican Republic
-
 Ecuador
-
 Egypt
Egypt
-
 El Salvador
-
 Estonia
-
 Eswatini
-
 Ethiopia
-
 Finland
-
 France
-
 Georgia
-
 Germany
-
 Ghana
Ghana
-
 Greece
-
 Haiti
Haiti
-
 Hong Kong
-
 Hungary
-
 India
India
-
 Indonesia
-
 Iran, Islamic republic
-
 Iraq
Iraq
-
 Ireland
-
 Israel
-
 Italy
Italy
-
 Jamaica
-
 Japan
Japan
-
 Jordan
-
 Kazakhstan
-
 Kenya
Kenya
-
 Korea
Korea
-
 Kuwait
-
 Kyrgyzstan
-
 Laos
Laos
-
 Latvia
-
 Lebanon
-
 Lesotho
-
 Libya
Libya
-
 Lithuania
-
 Luxembourg
-
 Madagascar
-
 Malaysia
-
 Malta
Malta
-
 Mauritius
-
 Mexico
-
 Moldova
-
 Mongolia
-
 Montenegro
-
 Morocco
-
 Mozambique
-
 Myanmar
-
 Namibia
-
 Nepal
Nepal
-
 Netherlands
-
 New Zealand
-
 Nigeria
-
 North Macedonia
-
 Norway
-
 Oman
Oman
-
 Pakistan
-
 Palestine
-
 Panama
-
 Papua New Guinea
-
 Paraguay
-
 Peru
Peru
-
 Philippines
-
 Poland
-
 Portugal
-
 Puerto Rico
-
 Qatar
Qatar
-
 Reunion
-
 Romania
-
 Rwanda
-
 Saudi Arabia
-
 Serbia
-
 Singapore
-
 Slovakia
-
 Slovenia
-
 Somalia
-
 South Africa
-
 Spain
Spain
-
 Sri Lanka
-
 Sweden
-
 Switzerland
-
 Syria
Syria
-
 Taiwan
-
 Tajikistan
-
 Tanzania
-
 Thailand
-
 Trinidad and Tobago
-
 Tunisia
-
 Turkey
-
 UAE
UAE
-
 Uganda
-
 Ukraine
-
 United Kingdom
-
United States
-
 Uruguay
-
 Uzbekistan
-
 Venezuela
-
 Vietnam
-
 Yemen
Yemen
-
 Zambia
-
 Zimbabwe
- Forex
- Crypto
