
Sui: Persistent negative momentum drives 7.35% drop despite deep oversold conditions

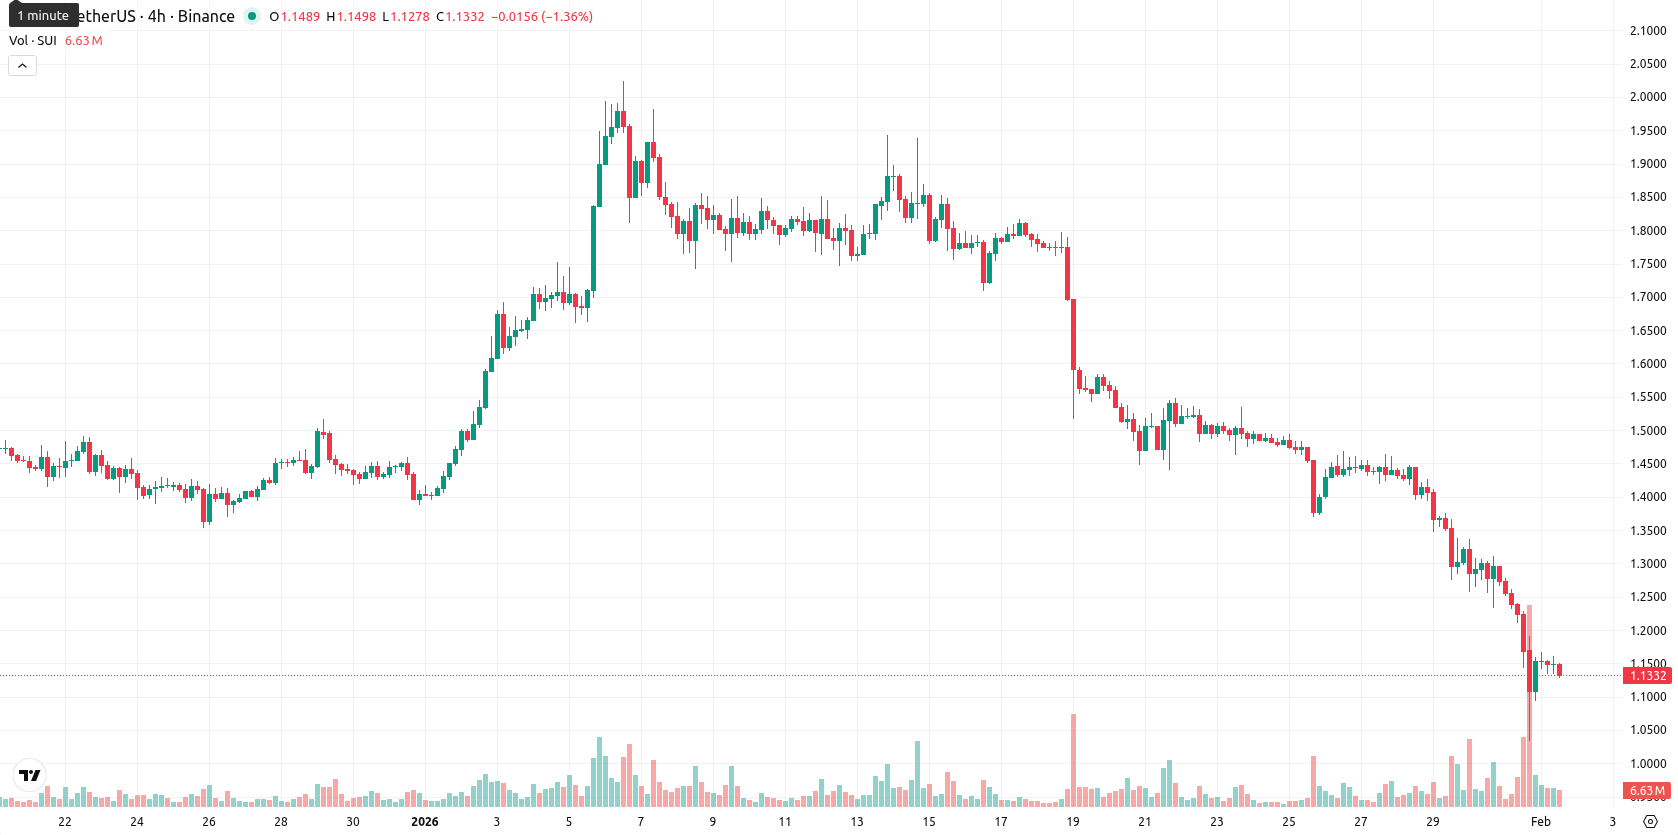
Sui (SUI) is trading at $1.1304 after a daily drop of 7.35%, remaining below the MA-20 ($1.5503), MA-50 ($1.5567), and MA-200 ($2.5820), which signals persistent downside pressure across all key timeframes.
Highlights
- SUI is trading at $1.1304, significantly below the MA-20 ($1.5503), MA-50 ($1.5567), and MA-200 ($2.5820), underscoring continued multi-timeframe bearish pressure.
- Momentum indicators including MACD, ADX, Stochastic RSI, and CCI all confirm a strong sell bias, with daily RSI extremely oversold at 23.65.
- Next five days project SUI trading between $1.05 and $1.24, with over 80% probability of further downside unless resistance at $1.16–$1.24 is breached.
Bearish momentum confirmed as oversold signals align with lack of support
Momentum signals remain bearish, with the MACD and ADX both confirming a sell bias and no sign of reversal. The RSI on the daily chart sits deep in oversold territory at 23.65, while Stochastic RSI and CCI also register oversold conditions. Bull/Bear Power is negative, underscoring the strong seller presence, and the price has opened notably lower with a gap down, currently near session lows for the day. The Ichimoku Kijun at $1.5580 acts as the closest resistance, with no firm Ichimoku-defined support, maintaining a bearish technical outlook.
Continued downside risk as volatility bands limit rebound potential
For the next five trading days, SUI is expected to remain within a volatility band relative to current levels, ranging from $1.05 to $1.24. All key weekly indicators continue to forecast a strong probability — over 80% — of further downside, with a lower likelihood of any rebound. The baseline scenario calls for a continuation of sideways-to-lower trading behavior near present levels. A break above the $1.16–$1.24 resistance zone could open room for a corrective rally, while a sustained move below $1.05 support would reinforce the bearish trend.
Sui (SUI) is demonstrating intensified bearish momentum, with the price sharply lower and trading well below all major moving averages, as both trend and momentum indicators confirm pronounced selling pressure. Oscillators including RSI, Stochastic RSI, and CCI signal extreme oversold conditions, while the absence of nearby support and high intraday volatility reinforce a sustained downside bias.


Latest SUI News


-
 Afghanistan
-
 Albania
-
 Algeria
-
 Angola
-
 Argentina
-
 Armenia
-
 Australia
-
 Austria
-
 Azerbaijan
-
 Bahamas
-
 Bahrain
-
 Bangladesh
-
 Belarus
-
 Belgium
-
 Bolivia
-
 Botswana
-
 Brazil
-
 Brunei
-
 Bulgaria
-
 Cambodia
-
 Cameroon
-
 Canada
-
 Chile
Chile
-
 China
China
-
 Colombia
-
 Congo
Congo
-
 Costa Rica
-
 Cote d'Ivoire
-
 Croatia
-
 Cuba
Cuba
-
 Cyprus
-
 Czechia
-
 DR Congo
-
 Denmark
-
 Dominican Republic
-
 Ecuador
-
 Egypt
Egypt
-
 El Salvador
-
 Estonia
-
 Eswatini
-
 Ethiopia
-
 Finland
-
 France
-
 Georgia
-
 Germany
-
 Ghana
Ghana
-
 Greece
-
 Haiti
Haiti
-
 Hong Kong
-
 Hungary
-
 India
India
-
 Indonesia
-
 Iran, Islamic republic
-
 Iraq
Iraq
-
 Ireland
-
 Israel
-
 Italy
Italy
-
 Jamaica
-
 Japan
Japan
-
 Jordan
-
 Kazakhstan
-
 Kenya
Kenya
-
 Korea
Korea
-
 Kuwait
-
 Kyrgyzstan
-
 Laos
Laos
-
 Latvia
-
 Lebanon
-
 Lesotho
-
 Libya
Libya
-
 Lithuania
-
 Luxembourg
-
 Madagascar
-
 Malaysia
-
 Malta
Malta
-
 Mauritius
-
 Mexico
-
 Moldova
-
 Mongolia
-
 Montenegro
-
 Morocco
-
 Mozambique
-
 Myanmar
-
 Namibia
-
 Nepal
Nepal
-
 Netherlands
-
 New Zealand
-
 Nigeria
-
 North Macedonia
-
 Norway
-
 Oman
Oman
-
 Pakistan
-
 Palestine
-
 Panama
-
 Papua New Guinea
-
 Paraguay
-
 Peru
Peru
-
 Philippines
-
 Poland
-
 Portugal
-
 Puerto Rico
-
 Qatar
Qatar
-
 Reunion
-
 Romania
-
 Rwanda
-
 Saudi Arabia
-
 Serbia
-
 Singapore
-
 Slovakia
-
 Slovenia
-
 Somalia
-
 South Africa
-
 Spain
Spain
-
 Sri Lanka
-
 Sweden
-
 Switzerland
-
 Syria
Syria
-
 Taiwan
-
 Tajikistan
-
 Tanzania
-
 Thailand
-
 Trinidad and Tobago
-
 Tunisia
-
 Turkey
-
 UAE
UAE
-
 Uganda
-
 Ukraine
-
 United Kingdom
-
United States
-
 Uruguay
-
 Uzbekistan
-
 Venezuela
-
 Vietnam
-
 Yemen
Yemen
-
 Zambia
-
 Zimbabwe
- Forex
- Crypto
