
Flow drops 9.86% as technical signals warn of further downside risk

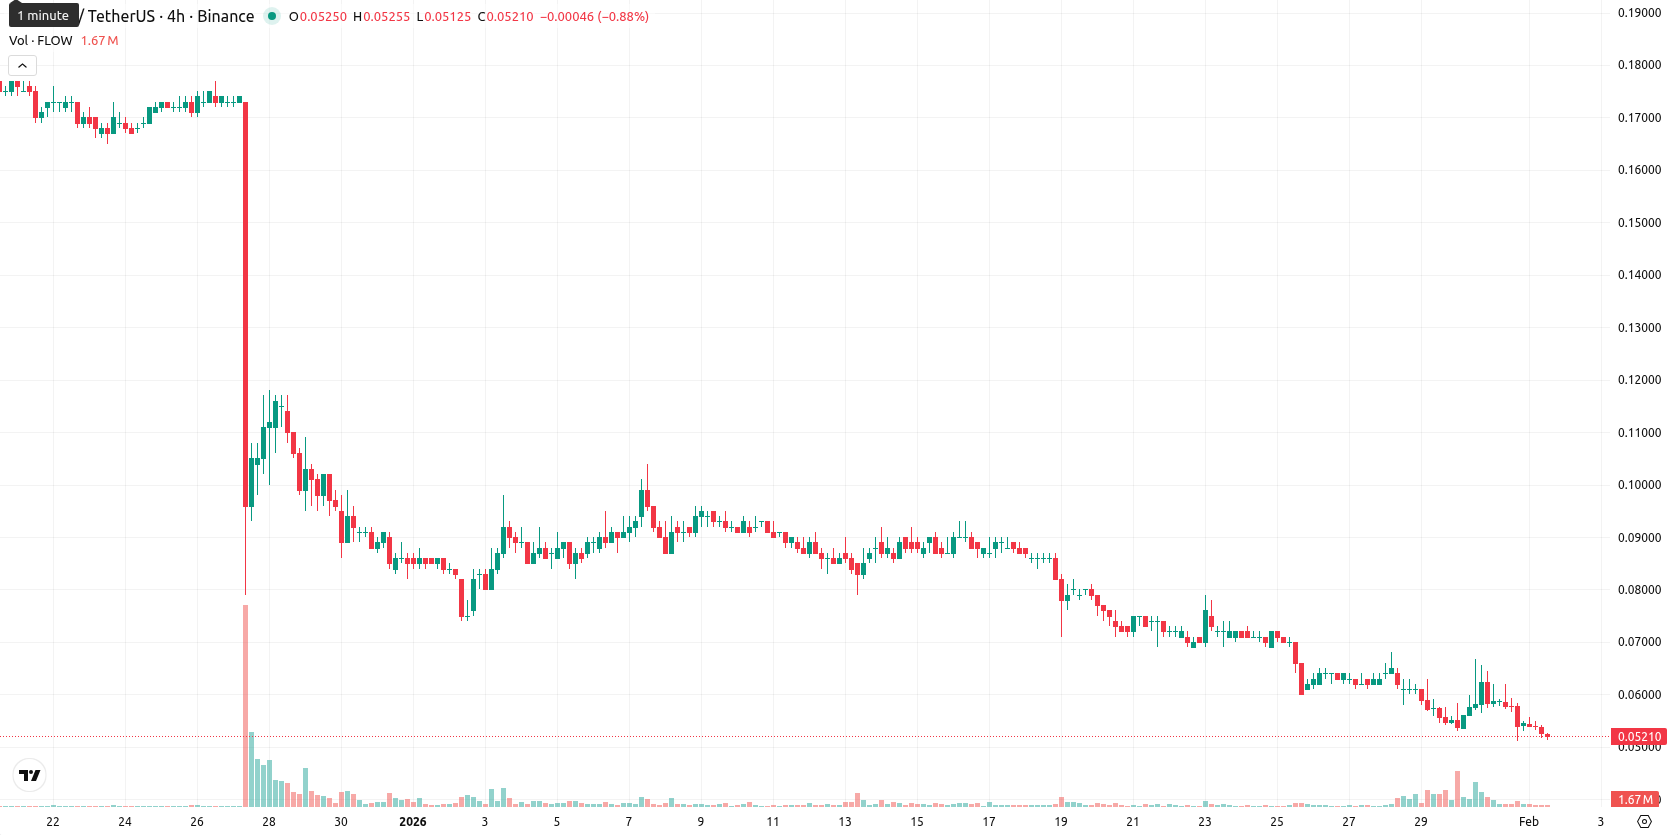
Flow (FLOW) is trading at $0.0521 after slipping 9.86% today, with the price sitting well below its MA-20 ($0.0731), MA-50 ($0.1082), and MA-200 ($0.2764) levels. This places the asset under persistent downward pressure across short-, medium-, and long-term moving averages.
Highlights
- FLOW trades at $0.0521, significantly below its MA-20 ($0.0731), MA-50 ($0.1082), and MA-200 ($0.2764), reflecting a persistent multi-timeframe downtrend.
- Daily MACD and ADX both confirm strong negative momentum, while RSI (20.67) and CCI (-121.9) indicate pronounced oversold conditions.
- Projected five-day trading range is $0.0460–$0.0570 with more than 80% probability of further decline, unless FLOW breaks above $0.0570 resistance.
Bearish momentum confirmed as resistance and oversold signals intensify
Technical analysis shows FLOW remains entrenched in a bearish trend, consistently trading under its key moving averages. The closest resistance is set by the Ichimoku Kijun at $0.0772, which continues to cap any near-term recovery attempts. Momentum indicators including the MACD and ADX on the daily chart both display clear sell signals, confirming strong negative bias. RSI (20.67) and CCI (-121.9) are in deep oversold territory, Stochastic RSI is neutral but close to its oversold threshold, while Bull/Bear Power underscores persistent seller dominance during intraday trades. The Awesome Oscillator remains neutral overall but generally supports the bearish outlook on intraday timeframes.
Downside favored as volatility and negative bias persist
Over the next five trading days, FLOW is projected to move within a typical volatility band of $0.0460–$0.0570, as technical signals suggest an ongoing bearish scenario. The probability of an upward move is very low (below 20%), while the probability of further decline remains high (above 80%), given consistently negative weekly indicators. The base scenario expects consolidation between $0.0460 and $0.0570, with any sustained move above $0.0570 requiring a break of resistance near the Ichimoku Kijun. Should the price fall below $0.0460, further downside acceleration is likely.
Last time, analysts noted that Flow is exhibiting sustained negative momentum, with the price trading well below all major moving averages and momentum indicators such as the MACD ADX RSI and CCI confirming a strongly bearish trend across all timeframes. With resistance established at the Ichimoku Kijun and no clear support in place, the asset remains vulnerable to further downside amid prevailing seller dominance.


Latest FLOW News


-
 Afghanistan
-
 Albania
-
 Algeria
-
 Angola
-
 Argentina
-
 Armenia
-
 Australia
-
 Austria
-
 Azerbaijan
-
 Bahamas
-
 Bahrain
-
 Bangladesh
-
 Belarus
-
 Belgium
-
 Bolivia
-
 Botswana
-
 Brazil
-
 Brunei
-
 Bulgaria
-
 Cambodia
-
 Cameroon
-
 Canada
-
 Chile
Chile
-
 China
China
-
 Colombia
-
 Congo
Congo
-
 Costa Rica
-
 Cote d'Ivoire
-
 Croatia
-
 Cuba
Cuba
-
 Cyprus
-
 Czechia
-
 DR Congo
-
 Denmark
-
 Dominican Republic
-
 Ecuador
-
 Egypt
Egypt
-
 El Salvador
-
 Estonia
-
 Eswatini
-
 Ethiopia
-
 Finland
-
 France
-
 Georgia
-
 Germany
-
 Ghana
Ghana
-
 Greece
-
 Haiti
Haiti
-
 Hong Kong
-
 Hungary
-
 India
India
-
 Indonesia
-
 Iran, Islamic republic
-
 Iraq
Iraq
-
 Ireland
-
 Israel
-
 Italy
Italy
-
 Jamaica
-
 Japan
Japan
-
 Jordan
-
 Kazakhstan
-
 Kenya
Kenya
-
 Korea
Korea
-
 Kuwait
-
 Kyrgyzstan
-
 Laos
Laos
-
 Latvia
-
 Lebanon
-
 Lesotho
-
 Libya
Libya
-
 Lithuania
-
 Luxembourg
-
 Madagascar
-
 Malaysia
-
 Malta
Malta
-
 Mauritius
-
 Mexico
-
 Moldova
-
 Mongolia
-
 Montenegro
-
 Morocco
-
 Mozambique
-
 Myanmar
-
 Namibia
-
 Nepal
Nepal
-
 Netherlands
-
 New Zealand
-
 Nigeria
-
 North Macedonia
-
 Norway
-
 Oman
Oman
-
 Pakistan
-
 Palestine
-
 Panama
-
 Papua New Guinea
-
 Paraguay
-
 Peru
Peru
-
 Philippines
-
 Poland
-
 Portugal
-
 Puerto Rico
-
 Qatar
Qatar
-
 Reunion
-
 Romania
-
 Rwanda
-
 Saudi Arabia
-
 Serbia
-
 Singapore
-
 Slovakia
-
 Slovenia
-
 Somalia
-
 South Africa
-
 Spain
Spain
-
 Sri Lanka
-
 Sweden
-
 Switzerland
-
 Syria
Syria
-
 Taiwan
-
 Tajikistan
-
 Tanzania
-
 Thailand
-
 Trinidad and Tobago
-
 Tunisia
-
 Turkey
-
 UAE
UAE
-
 Uganda
-
 Ukraine
-
 United Kingdom
-
United States
-
 Uruguay
-
 Uzbekistan
-
 Venezuela
-
 Vietnam
-
 Yemen
Yemen
-
 Zambia
-
 Zimbabwe
- Forex
- Crypto
