
Polygon climbs 10.04% as short-term recovery attempts meet strong resistance

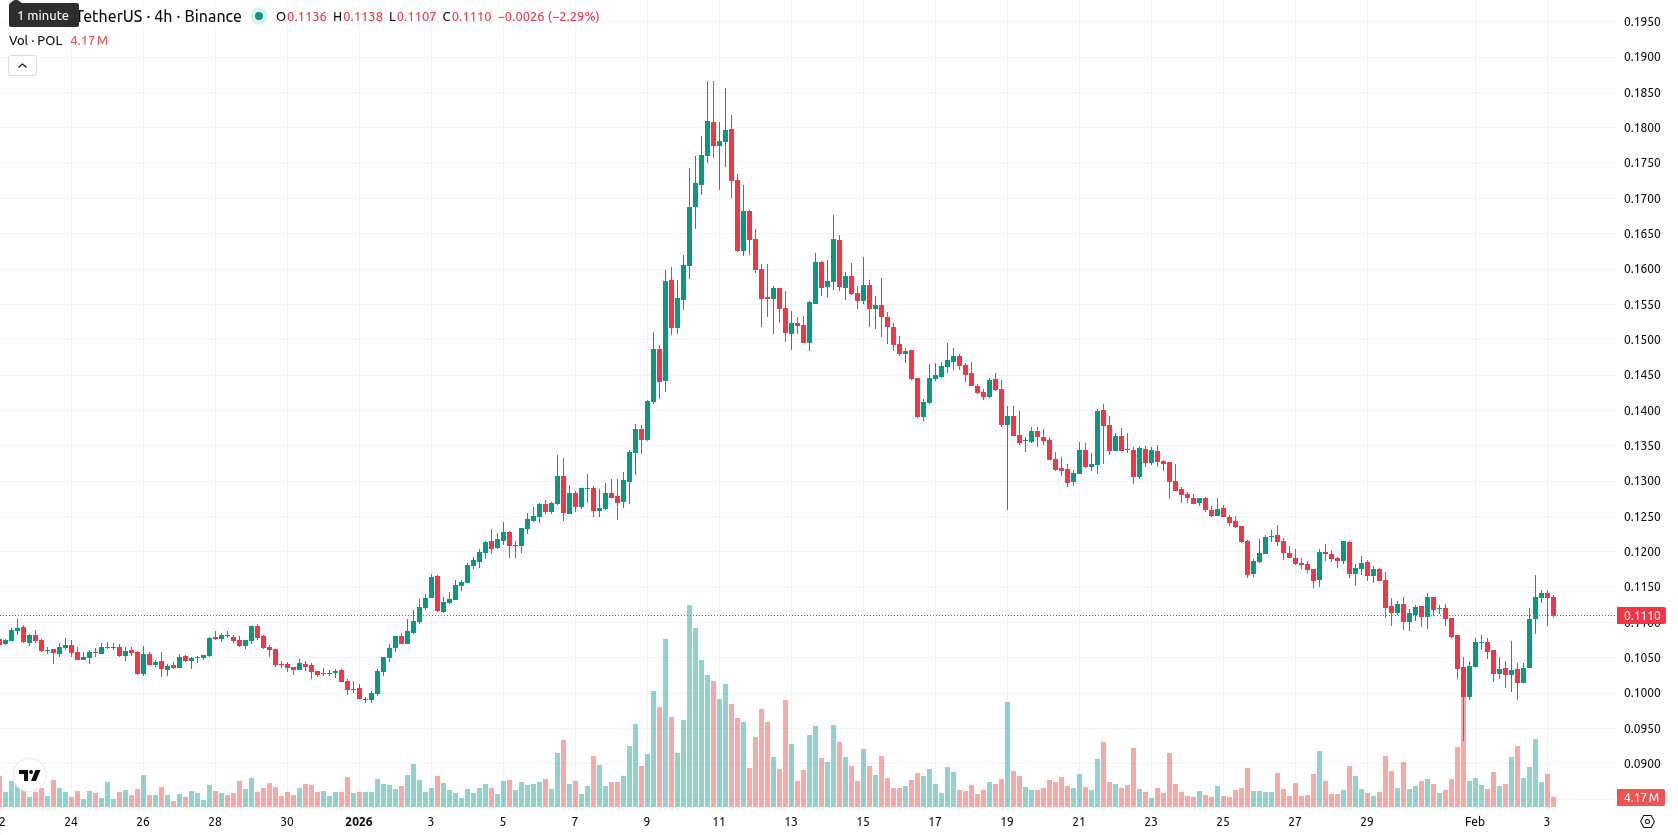
Polygon (POL, formerly MATIC) is trading at $0.1107 after moving up $0.0101, or 10.04% today. The asset remains well below its MA-20 ($0.1270), MA-50 ($0.1227), and MA-200 ($0.1864), underlining persistent downside pressure across all major timeframes.
Highlights
- POL is trading at $0.1107, below its MA-20 ($0.1270), MA-50 ($0.1227), and MA-200 ($0.1864), signaling sustained downside across all timeframes.
- Momentum and trend indicators—including MACD, ADX, and Awesome Oscillator—are bearish, with weekly indicators showing under 20% probability of an upward breakout.
- The realistic weekly trading range for POL is $0.1000–$0.1320; a break above $0.1320 could target $0.1400, while failure risks a move below $0.1000.
Ongoing bearish momentum as oscillators signal weak recovery attempts
Momentum on the daily chart remains negative, with both MACD and ADX signaling a bearish trend. Key oscillators — RSI (41.21), Stochastic RSI (Strong Buy), and CCI (–92.05) — show mild short-term attempts at recovery from oversold, but the overall picture remains weak. Bull/Bear Power registers a slight dominance of sellers, while the Awesome Oscillator continues to support the prevailing bearish momentum. The Ichimoku Kijun level at $0.1399 now acts as initial resistance.
Broad rangebound outlook as bearish bias limits breakout potential
Over the next five sessions, POL is expected to remain rangebound within a typical volatility band of $0.1000 – $0.1320, as technical indicators offer little support for a significant breakout. The probability of an upward move remains below 20%, given the ongoing bearish bias and lack of technical buy signals on the weekly chart. While a bullish scenario would require a firm break above $0.1320 to challenge the $0.1400 level, continued consolidation or further downside toward or below $0.1000 remains more likely unless price action reverses above nearby resistance.
Last time, analysts noted that Polygon (POL) remains under bearish pressure, trading below all major moving averages with both momentum and oscillators such as MACD, RSI, and ADX signaling persistent oversold conditions. Despite a notable intraday rebound, the asset faces dynamic resistance at $0.1228 and $0.1399, while continued selling pressure suggests limited upside unless key barriers are reclaimed.


-
 Afghanistan
-
 Albania
-
 Algeria
-
 Angola
-
 Argentina
-
 Armenia
-
 Australia
-
 Austria
-
 Azerbaijan
-
 Bahamas
-
 Bahrain
-
 Bangladesh
-
 Belarus
-
 Belgium
-
 Bolivia
-
 Botswana
-
 Brazil
-
 Brunei
-
 Bulgaria
-
 Cambodia
-
 Cameroon
-
 Canada
-
 Chile
Chile
-
 China
China
-
 Colombia
-
 Congo
Congo
-
 Costa Rica
-
 Cote d'Ivoire
-
 Croatia
-
 Cuba
Cuba
-
 Cyprus
-
 Czechia
-
 DR Congo
-
 Denmark
-
 Dominican Republic
-
 Ecuador
-
 Egypt
Egypt
-
 El Salvador
-
 Estonia
-
 Eswatini
-
 Ethiopia
-
 Finland
-
 France
-
 Georgia
-
 Germany
-
 Ghana
Ghana
-
 Greece
-
 Haiti
Haiti
-
 Hong Kong
-
 Hungary
-
 India
India
-
 Indonesia
-
 Iran, Islamic republic
-
 Iraq
Iraq
-
 Ireland
-
 Israel
-
 Italy
Italy
-
 Jamaica
-
 Japan
Japan
-
 Jordan
-
 Kazakhstan
-
 Kenya
Kenya
-
 Korea
Korea
-
 Kuwait
-
 Kyrgyzstan
-
 Laos
Laos
-
 Latvia
-
 Lebanon
-
 Lesotho
-
 Libya
Libya
-
 Lithuania
-
 Luxembourg
-
 Madagascar
-
 Malaysia
-
 Malta
Malta
-
 Mauritius
-
 Mexico
-
 Moldova
-
 Mongolia
-
 Montenegro
-
 Morocco
-
 Mozambique
-
 Myanmar
-
 Namibia
-
 Nepal
Nepal
-
 Netherlands
-
 New Zealand
-
 Nigeria
-
 North Macedonia
-
 Norway
-
 Oman
Oman
-
 Pakistan
-
 Palestine
-
 Panama
-
 Papua New Guinea
-
 Paraguay
-
 Peru
Peru
-
 Philippines
-
 Poland
-
 Portugal
-
 Puerto Rico
-
 Qatar
Qatar
-
 Reunion
-
 Romania
-
 Rwanda
-
 Saudi Arabia
-
 Serbia
-
 Singapore
-
 Slovakia
-
 Slovenia
-
 Somalia
-
 South Africa
-
 Spain
Spain
-
 Sri Lanka
-
 Sweden
-
 Switzerland
-
 Syria
Syria
-
 Taiwan
-
 Tajikistan
-
 Tanzania
-
 Thailand
-
 Trinidad and Tobago
-
 Tunisia
-
 Turkey
-
 UAE
UAE
-
 Uganda
-
 Ukraine
-
 United Kingdom
-
United States
-
 Uruguay
-
 Uzbekistan
-
 Venezuela
-
 Vietnam
-
 Yemen
Yemen
-
 Zambia
-
 Zimbabwe
- Forex
- Crypto
