
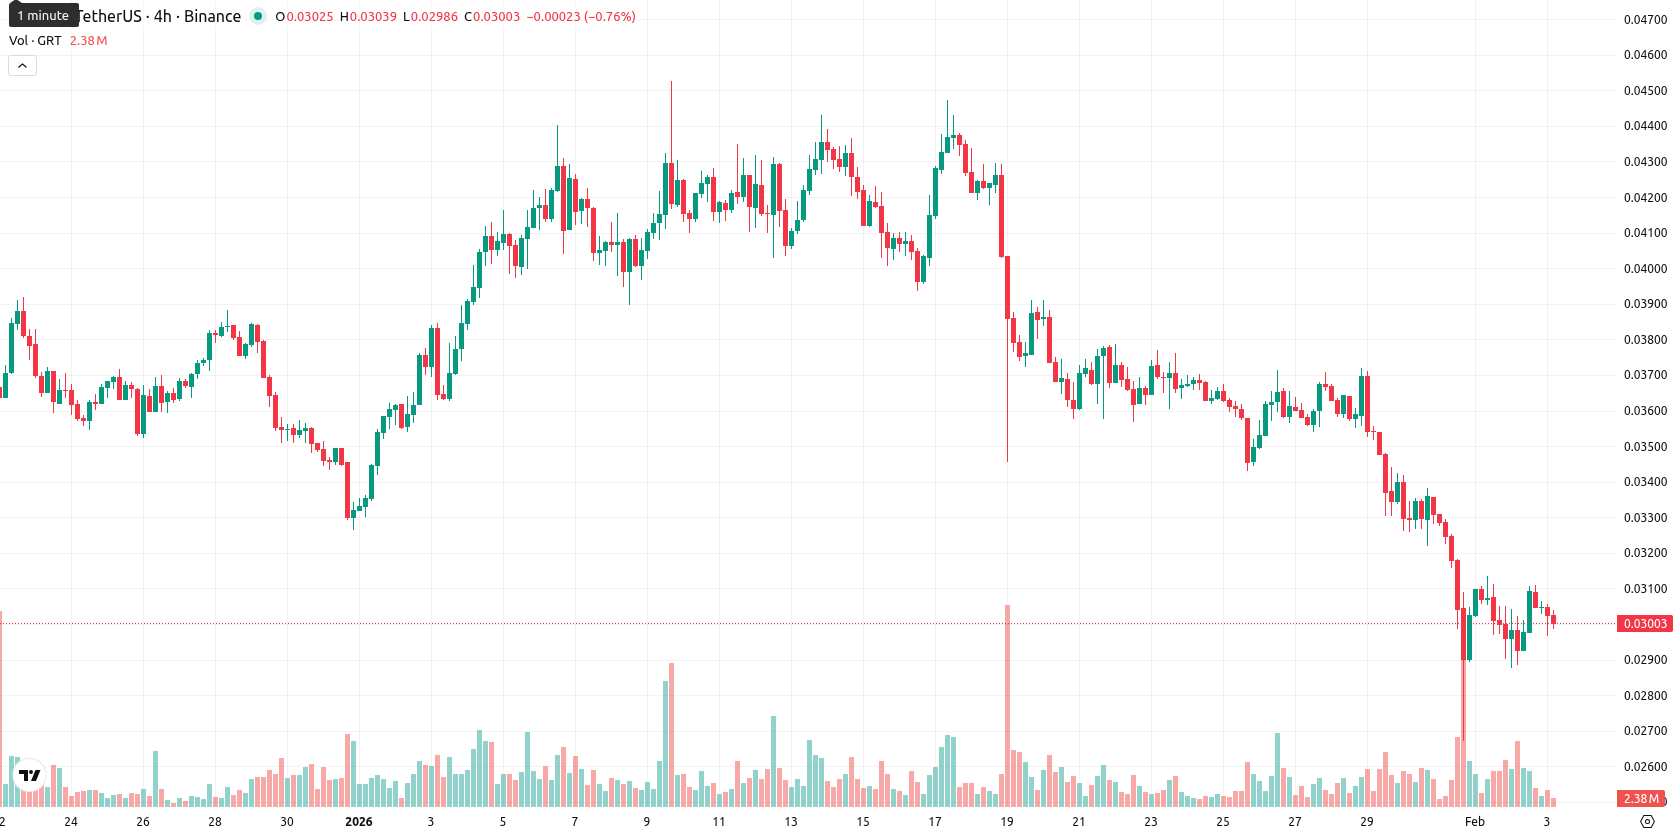
GRT weekly forecast: trades around $0.02993 — technical indicators signal persistent seller control

The Graph (GRT) is currently trading at $0.02993, reflecting a weekly gain of 2.19%. Despite this modest advance, the asset remains decisively beneath its MA-20 ($0.03654300), MA-50 ($0.03766560), and MA-200 ($0.06738005) on the weekly chart, underscoring sustained downward momentum and persistent selling pressure.
Highlights
- GRT is trading at $0.02993, well below its MA-20 ($0.03654), MA-50 ($0.03767), and MA-200 ($0.06738), signaling strong multi-timeframe bearish pressure.
- MACD, ADX, and the Awesome Oscillator all confirm a bearish structure, while oversold RSI and CCI suggest potential for volatile swings or false reversal.
- Immediate resistance stands at the Ichimoku Kijun ($0.03599) with weak support near $0.028; price is expected to consolidate between $0.028 and $0.032 next five days.
Bearish momentum sustained as indicators reinforce seller control this week
On the weekly timeframe, GRT is demonstrating a bearish structure, trading below all major moving averages (MA-20, MA-50, and MA-200). The Ichimoku Kijun serves as dynamic resistance at $0.03598500, while the region near recent annual lows acts as weak support. Technical indicators remain negative overall: the weekly MACD and ADX both signal ongoing bearish momentum, and the Awesome Oscillator confirms the downtrend. Weekly RSI and CCI show oversold conditions and the stochastic RSI hints at a possible short-term bounce, but overall seller dominance is maintained, as expressed by a persistently negative Bull/Bear Power reading.
Rangebound outlook as reversal odds remain low for the coming week
For the next five to seven trading days, GRT is likely to consolidate in the $0.028 to $0.032 range, as weekly technicals suggest little chance for a convincing reversal. The probability of a sustained price increase is below 20%, and risks of further decline remain elevated. A bullish scenario would require a decisive breakout above the weekly Ichimoku Kijun near $0.036, while a weekly close below $0.028 could open the way for new lows and continued selling pressure.
Previously it was reported that The Graph remains under sustained seller pressure, trading below all major moving averages with momentum indicators such as RSI and MACD indicating deeply oversold conditions and persistent bearish sentiment. Immediate resistance is noted at the Ichimoku Kijun, with no significant support nearby, suggesting limited rebound potential and a likely continuation of sideways to downward consolidation in the near term.


-
 Afghanistan
-
 Albania
-
 Algeria
-
 Angola
-
 Argentina
-
 Armenia
-
 Australia
-
 Austria
-
 Azerbaijan
-
 Bahamas
-
 Bahrain
-
 Bangladesh
-
 Belarus
-
 Belgium
-
 Bolivia
-
 Botswana
-
 Brazil
-
 Brunei
-
 Bulgaria
-
 Cambodia
-
 Cameroon
-
 Canada
-
 Chile
Chile
-
 China
China
-
 Colombia
-
 Congo
Congo
-
 Costa Rica
-
 Cote d'Ivoire
-
 Croatia
-
 Cuba
Cuba
-
 Cyprus
-
 Czechia
-
 DR Congo
-
 Denmark
-
 Dominican Republic
-
 Ecuador
-
 Egypt
Egypt
-
 El Salvador
-
 Estonia
-
 Eswatini
-
 Ethiopia
-
 Finland
-
 France
-
 Georgia
-
 Germany
-
 Ghana
Ghana
-
 Greece
-
 Haiti
Haiti
-
 Hong Kong
-
 Hungary
-
 India
India
-
 Indonesia
-
 Iran, Islamic republic
-
 Iraq
Iraq
-
 Ireland
-
 Israel
-
 Italy
Italy
-
 Jamaica
-
 Japan
Japan
-
 Jordan
-
 Kazakhstan
-
 Kenya
Kenya
-
 Korea
Korea
-
 Kuwait
-
 Kyrgyzstan
-
 Laos
Laos
-
 Latvia
-
 Lebanon
-
 Lesotho
-
 Libya
Libya
-
 Lithuania
-
 Luxembourg
-
 Madagascar
-
 Malaysia
-
 Malta
Malta
-
 Mauritius
-
 Mexico
-
 Moldova
-
 Mongolia
-
 Montenegro
-
 Morocco
-
 Mozambique
-
 Myanmar
-
 Namibia
-
 Nepal
Nepal
-
 Netherlands
-
 New Zealand
-
 Nigeria
-
 North Macedonia
-
 Norway
-
 Oman
Oman
-
 Pakistan
-
 Palestine
-
 Panama
-
 Papua New Guinea
-
 Paraguay
-
 Peru
Peru
-
 Philippines
-
 Poland
-
 Portugal
-
 Puerto Rico
-
 Qatar
Qatar
-
 Reunion
-
 Romania
-
 Rwanda
-
 Saudi Arabia
-
 Serbia
-
 Singapore
-
 Slovakia
-
 Slovenia
-
 Somalia
-
 South Africa
-
 Spain
Spain
-
 Sri Lanka
-
 Sweden
-
 Switzerland
-
 Syria
Syria
-
 Taiwan
-
 Tajikistan
-
 Tanzania
-
 Thailand
-
 Trinidad and Tobago
-
 Tunisia
-
 Turkey
-
 UAE
UAE
-
 Uganda
-
 Ukraine
-
 United Kingdom
-
United States
-
 Uruguay
-
 Uzbekistan
-
 Venezuela
-
 Vietnam
-
 Yemen
Yemen
-
 Zambia
-
 Zimbabwe
- Forex
- Crypto
